Commercial Land
1732-1764 East 116th Street Carmel, IN 46032
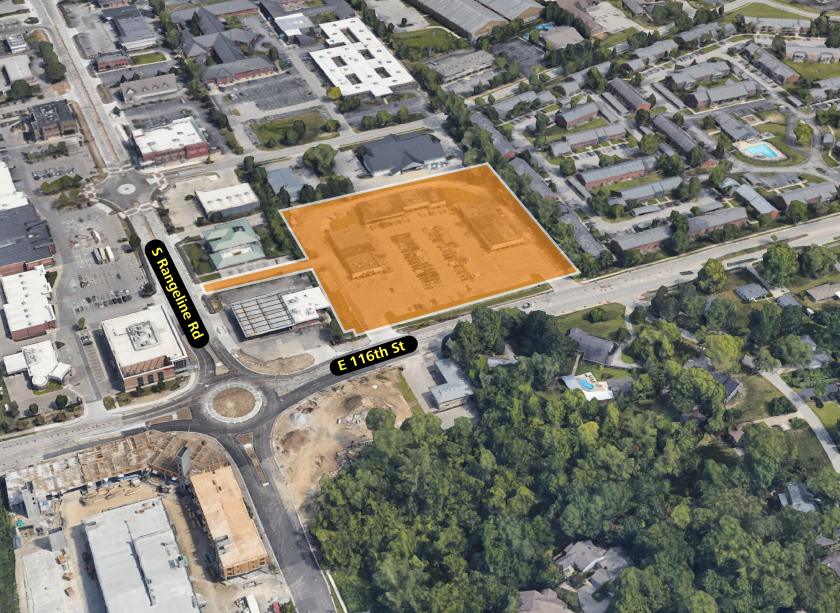
1732-1764 East 116th Street Carmel, IN 46032
Details & Description
Property Highlights
- • Rare development site in the heart of Carmel
- • Conveniently located at 116th and Westfield Blvd
- • Zoned B-8
Listing Agents

Liz DeKoninck
O: 317-536-0093
M: 765-516-4709
liz@halakar.com
O: 317-536-0093
M: 765-516-4709
liz@halakar.com
While we strive to provide the most accurate information, all listing information, and demographic data, is provided by third-parties. As such, MyEListing will not be responsible for the accuracy of the information. It is strongly recommended that you verify all information with the listing agent, and any relevant agencies, prior to making any decisions.