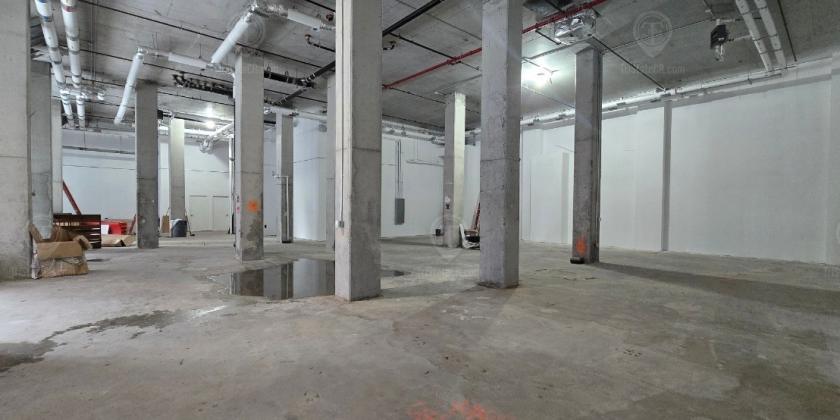
Retail Space
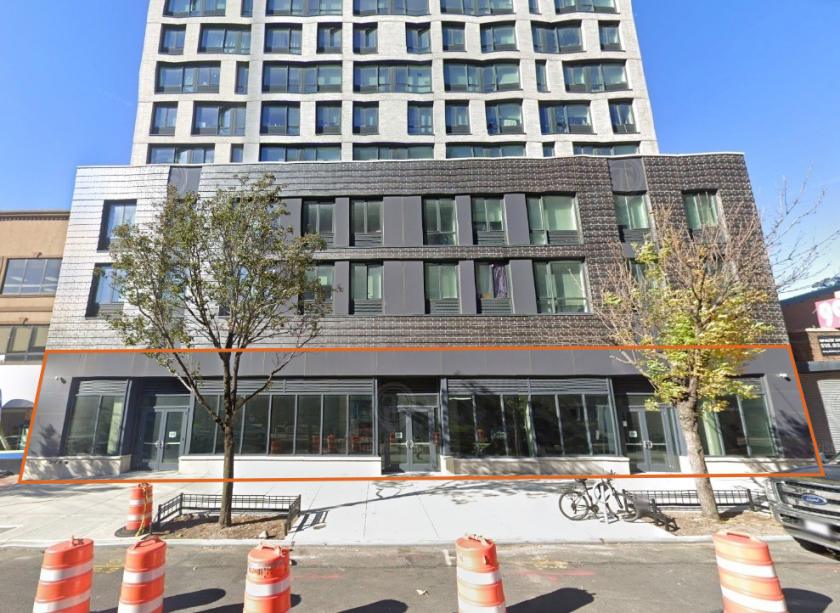
153-19 Jamaica Avenue Queens, NY 11432
153-19 Jamaica Avenue Queens, NY 11432
Details & Description
Property Highlights
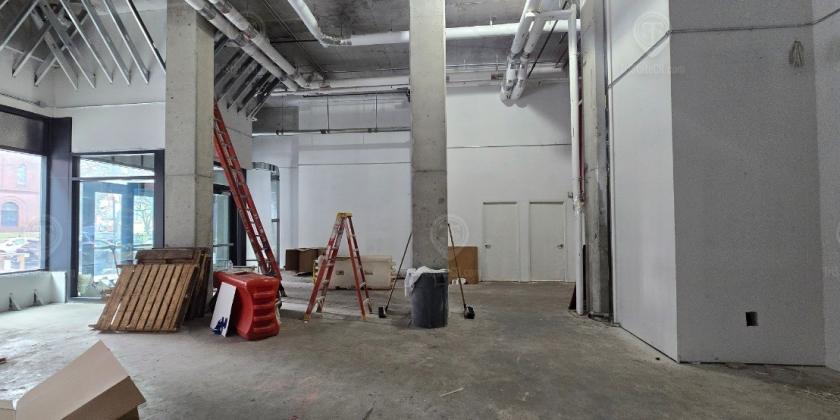
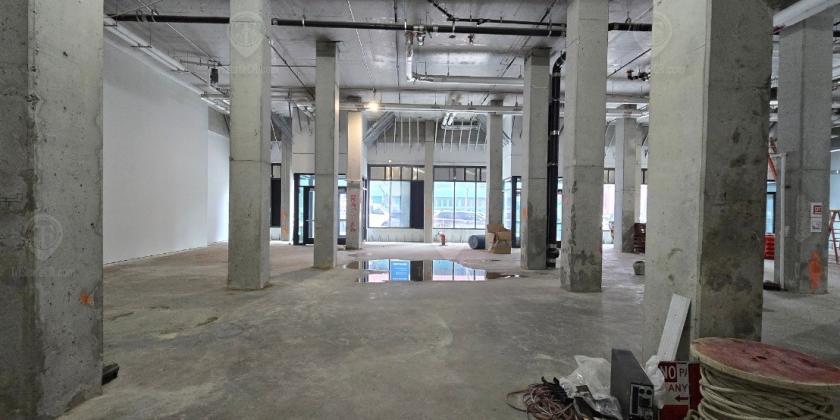
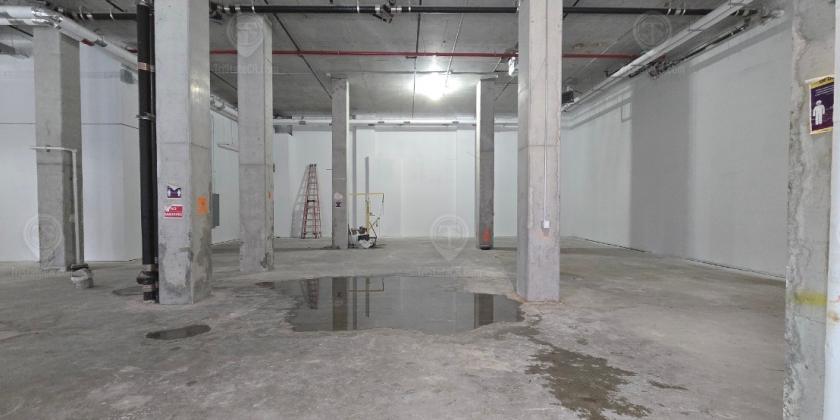
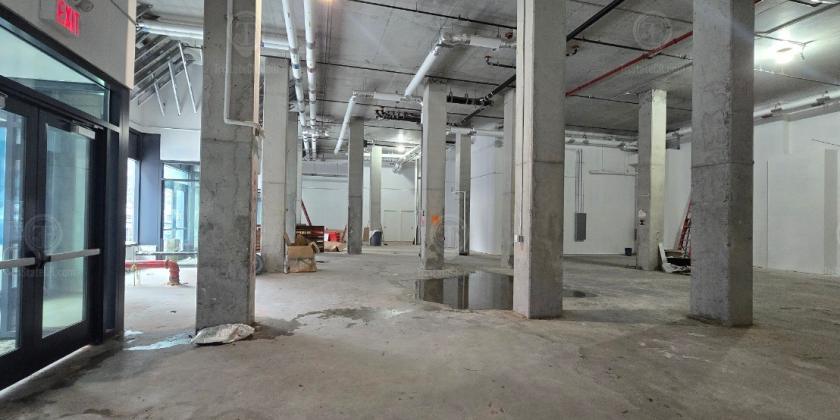
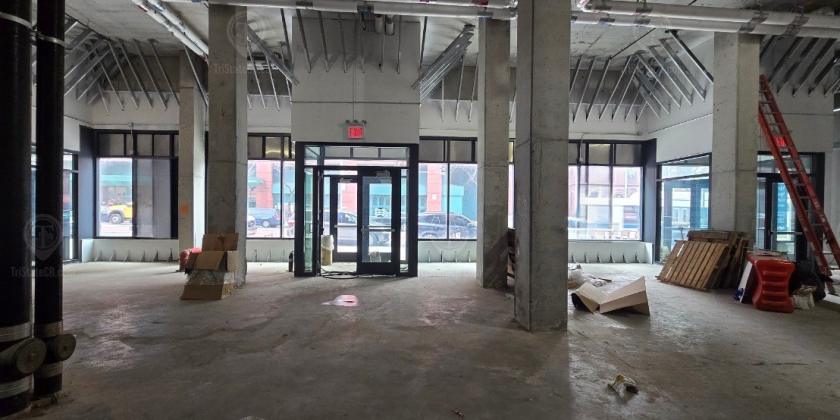
- • 100 ft of glass frontage
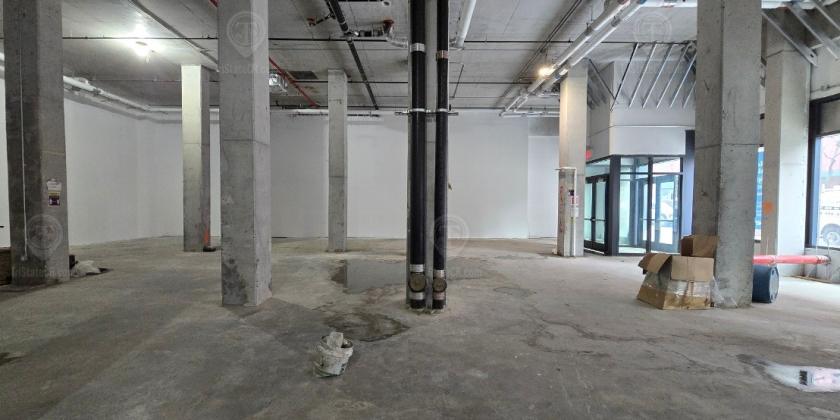
- • 20 ft ceilings
- • Black iron duct in place
- • Divisions are possible
Additional Photos


Listing Agents

Shlomi Bagdadi
O: 718-437-6100
info@tristatecr.com
O: 718-437-6100
info@tristatecr.com
While we strive to provide the most accurate information, all listing information, and demographic data, is provided by third-parties. As such, MyEListing will not be responsible for the accuracy of the information. It is strongly recommended that you verify all information with the listing agent, and any relevant agencies, prior to making any decisions.