Office Space
5011 East Rosa Parks Place Sioux Falls, SD 57110
5011 East Rosa Parks Place Sioux Falls, SD 57110

Details & Description
Property Highlights
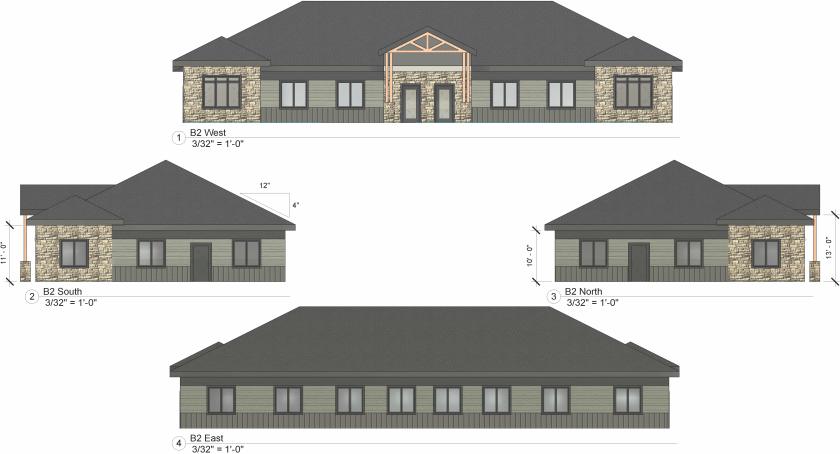
- • Multi-tenant office building
- • Occupancy Q4 2024
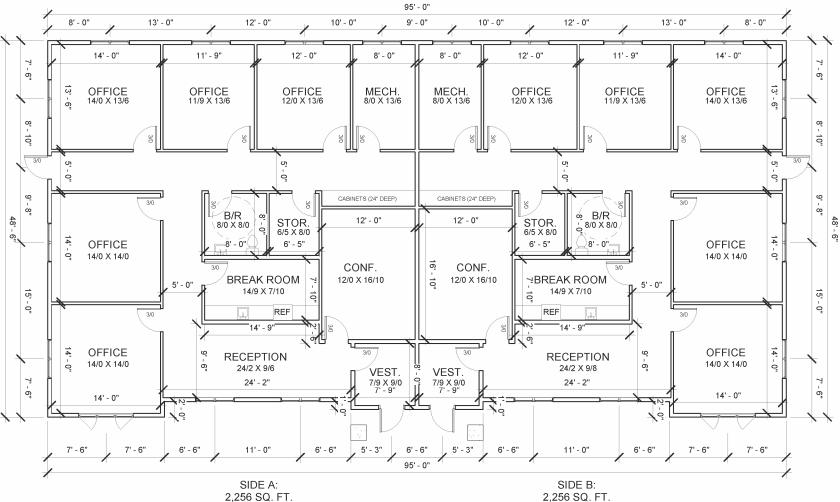
- • Floor plans can be adjusted per tenant/buyer need
- • Side A (South Suite): 2,256 SF
- • Side B (North Suite): 2,256 SF
Additional Photos

Listing Agents

Marcus Mahlen
O: 605-444-7116
M: 605-228-9744
mmahlen@naisiouxfalls.com
O: 605-444-7116
M: 605-228-9744
mmahlen@naisiouxfalls.com
While we strive to provide the most accurate information, all listing information, and demographic data, is provided by third-parties. As such, MyEListing will not be responsible for the accuracy of the information. It is strongly recommended that you verify all information with the listing agent, and any relevant agencies, prior to making any decisions.


