Industrial Properties
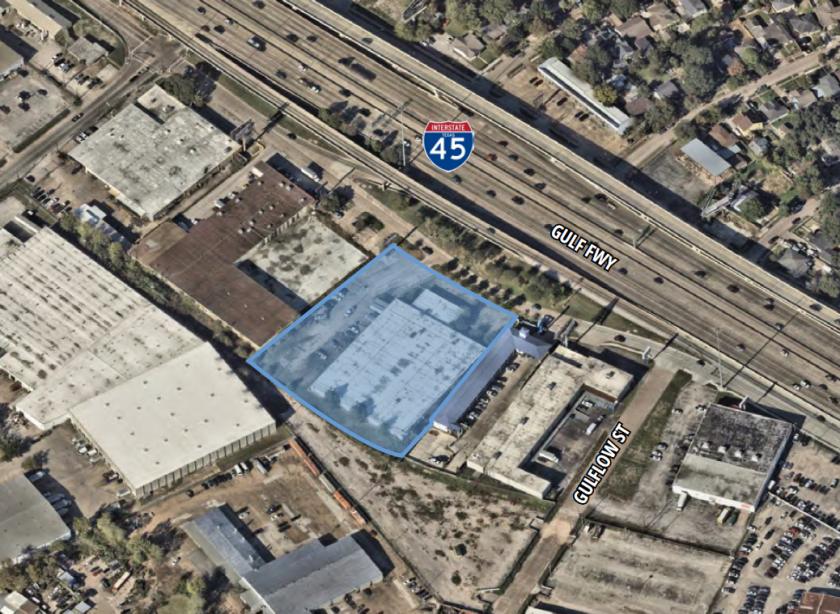
6654 Gulf Freeway Houston, TX 77087
6654 Gulf Freeway Houston, TX 77087
Details & Description
Property Highlights
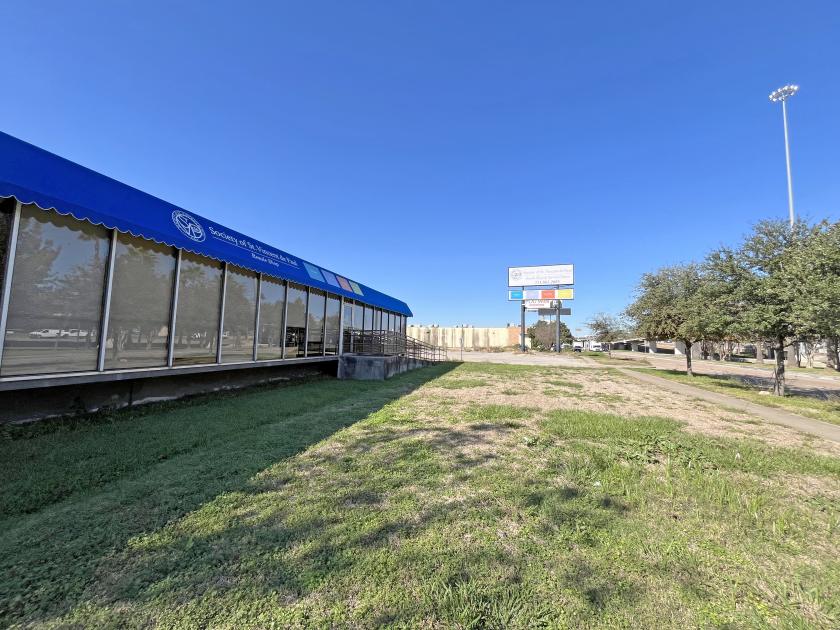
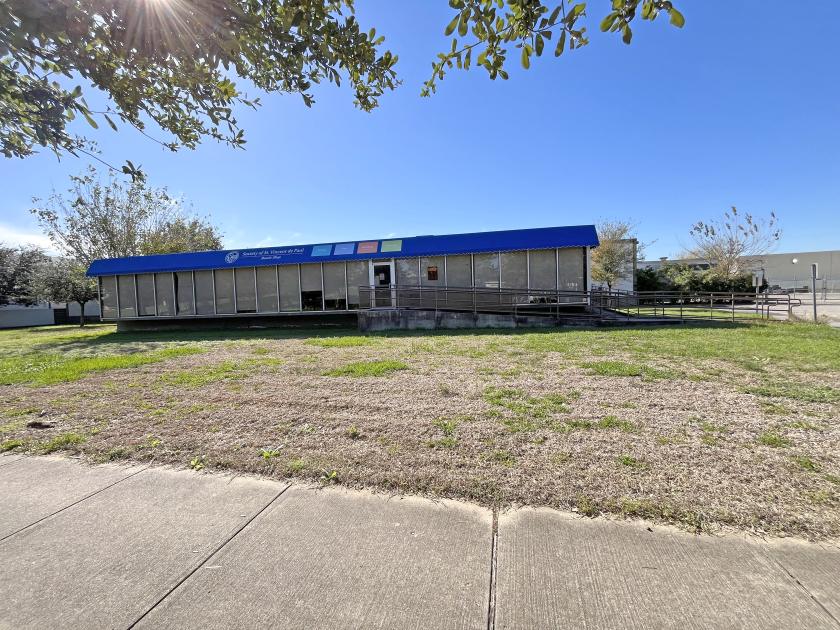
- • ± 9,285 SF of office/showroom
- • Inside 610 Loop, near southeast location
- • I-45 address; ± 270’ I-45 frontage
- • High pylon signage
- • 14’ Clear height
- • Sprinklered fire protection
Additional Photos

Listing Agents

Bill Byrd
O: 713-830-2131
M: 713-628-2022
bill.byrd@colliers.com
O: 713-830-2131
M: 713-628-2022
bill.byrd@colliers.com

John Parsley
O: 713-830-2140
M: 281-236-6558
john.parsley@colliers.com
O: 713-830-2140
M: 281-236-6558
john.parsley@colliers.com

Bob Parsley
O: 713-830-2121
M: 713-501-3996
bob.parsley@colliers.com
O: 713-830-2121
M: 713-501-3996
bob.parsley@colliers.com
While we strive to provide the most accurate information, all listing information, and demographic data, is provided by third-parties. As such, MyEListing will not be responsible for the accuracy of the information. It is strongly recommended that you verify all information with the listing agent, and any relevant agencies, prior to making any decisions.


