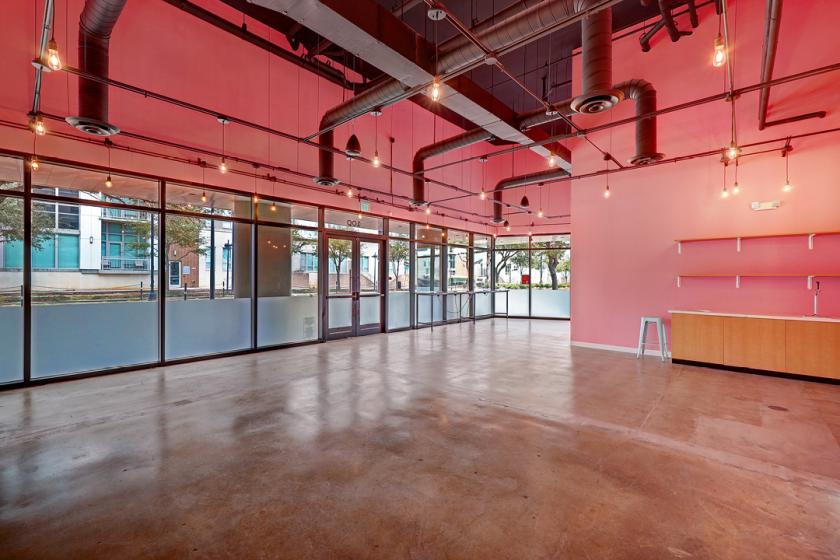
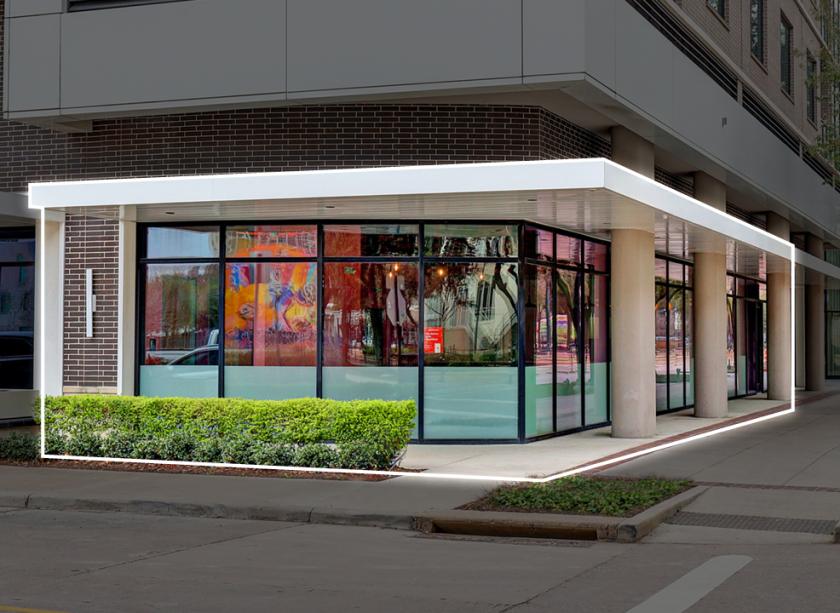
Retail Space
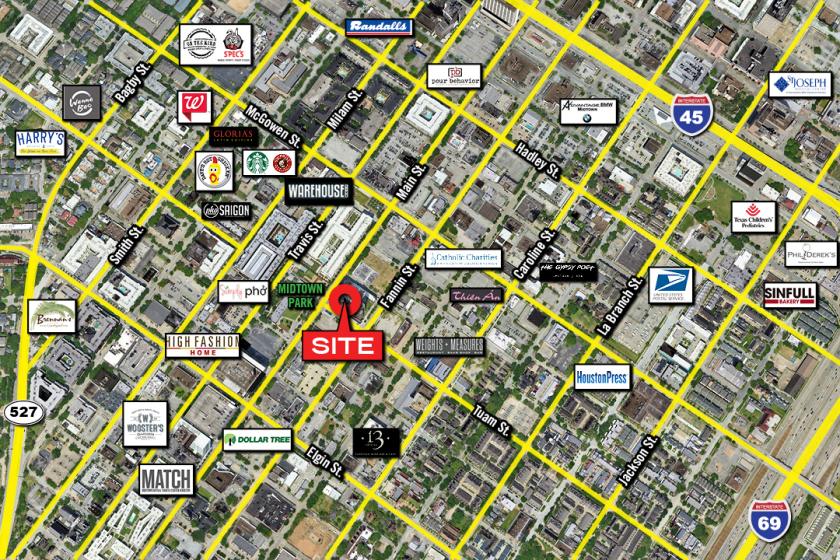
2850 Fannin Street Houston, TX 77002
2850 Fannin Street Houston, TX 77002
Details & Description
Property Highlights
- • Second Generation Turnkey Café
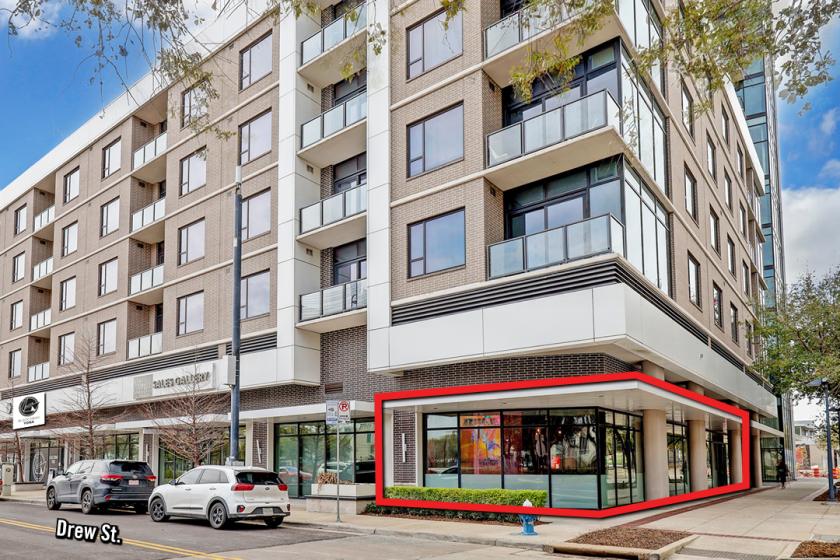
- • Ground Level Retail at Drewery Place – 357 Units
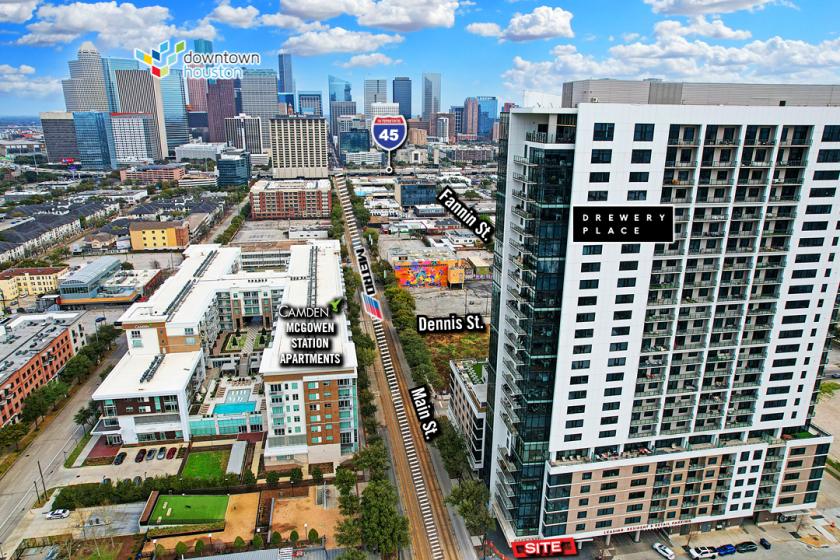
- • High Daytime Populations and Incomes
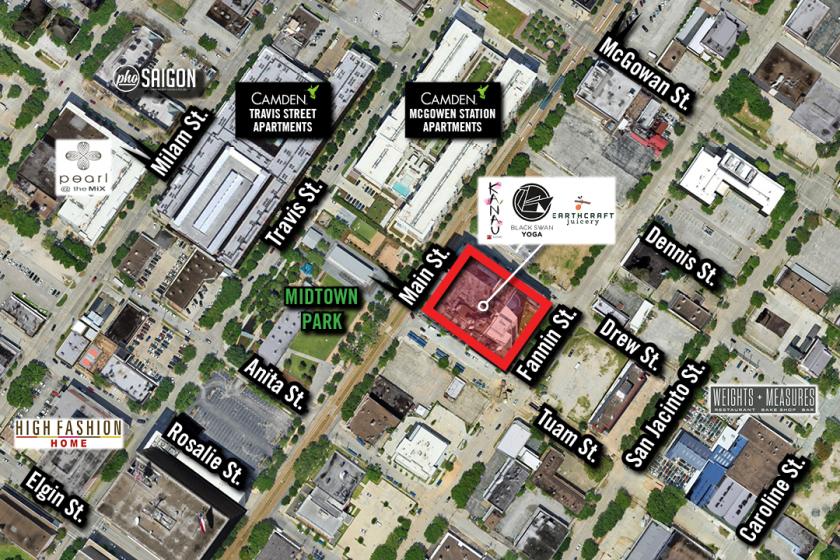
- • Heart of Midtown - Between Fannin St. and Main St.
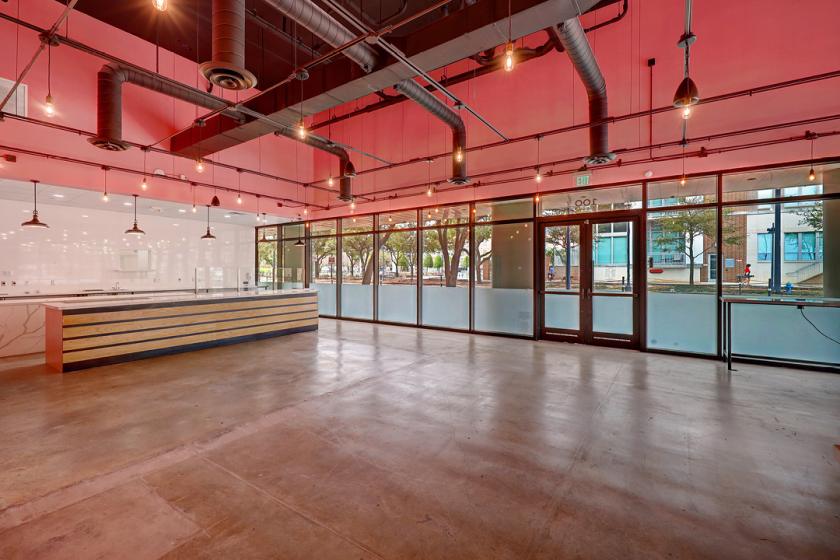
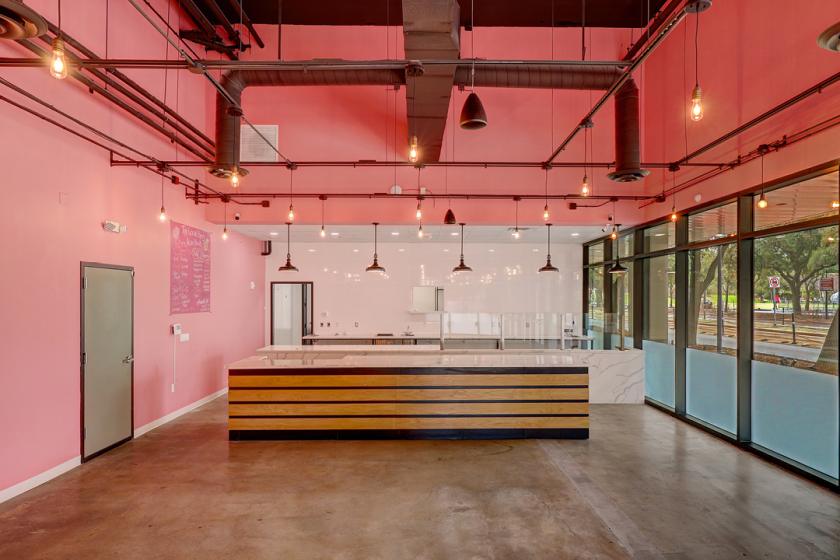
Additional Photos

Listing Agents

Lisa Rimkus
O: 281-501-1725
lisa@davis-commercial.com
O: 281-501-1725
lisa@davis-commercial.com
While we strive to provide the most accurate information, all listing information, and demographic data, is provided by third-parties. As such, MyEListing will not be responsible for the accuracy of the information. It is strongly recommended that you verify all information with the listing agent, and any relevant agencies, prior to making any decisions.