Commercial Land
28-42 Ryle Avenue Paterson, NJ 07522
28-42 Ryle Avenue Paterson, NJ 07522
Details & Description
Property Highlights
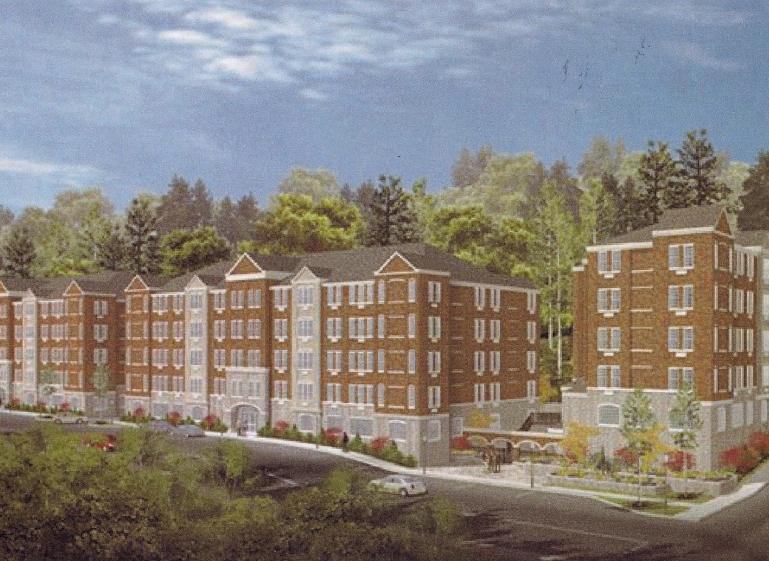
- • ±1.5-Acre Development Project
- • Previously Approved for 90+ Residential Units
- • Taxes at $31,194.24 (2022)
Listing Agents

Juan Disla
O: 973-379-6644
jd@blauberg.com
O: 973-379-6644
jd@blauberg.com
While we strive to provide the most accurate information, all listing information, and demographic data, is provided by third-parties. As such, MyEListing will not be responsible for the accuracy of the information. It is strongly recommended that you verify all information with the listing agent, and any relevant agencies, prior to making any decisions.


