Office Space
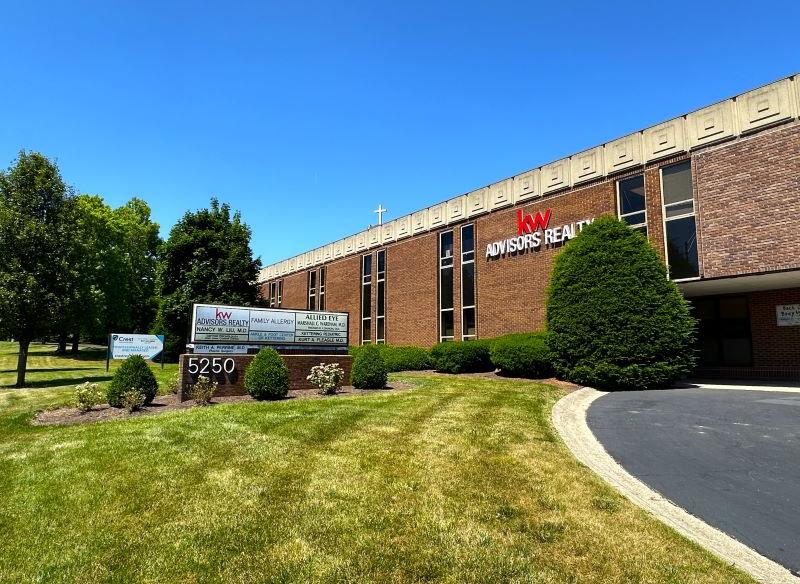
5250 Far Hills Avenue Dayton, OH 45429
5250 Far Hills Avenue Dayton, OH 45429
Details & Description
Property Highlights
• Established medical building on busy Far Hills Ave in Kettering.
• Convenient first floor location is move-in ready
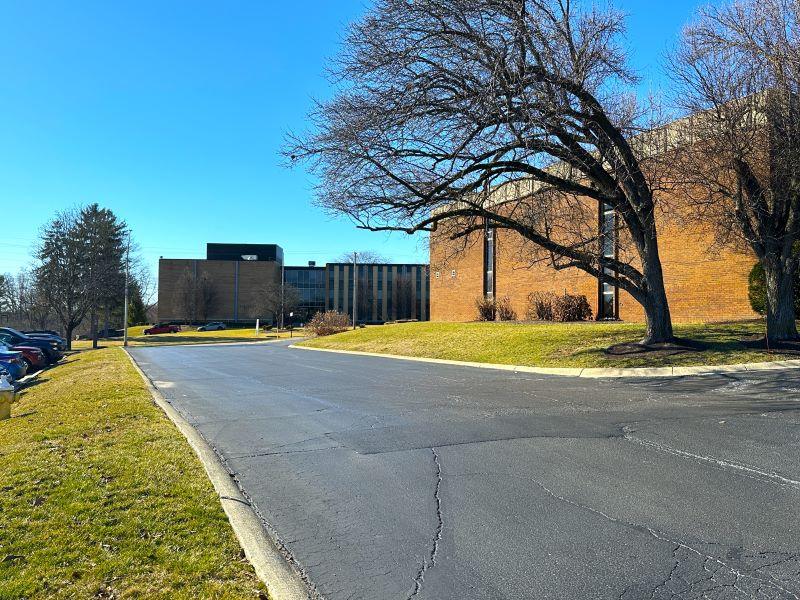
Additional Photos


Listing Agents

Nick Miller-Jacobson
O: 937-222-1600
M: 937-631-6261
nick@crestrealtyohio.com
O: 937-222-1600
M: 937-631-6261
nick@crestrealtyohio.com
While we strive to provide the most accurate information, all listing information, and demographic data, is provided by third-parties. As such, MyEListing will not be responsible for the accuracy of the information. It is strongly recommended that you verify all information with the listing agent, and any relevant agencies, prior to making any decisions.


