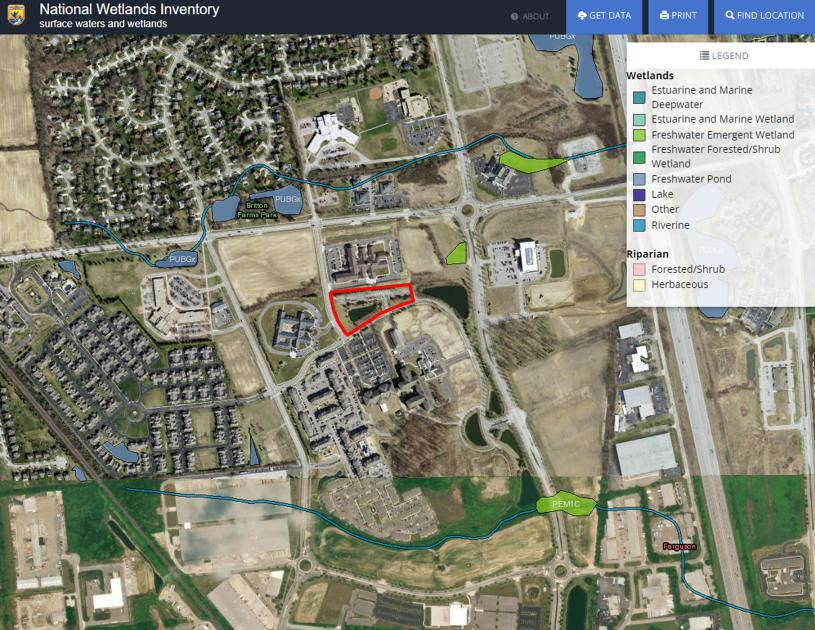
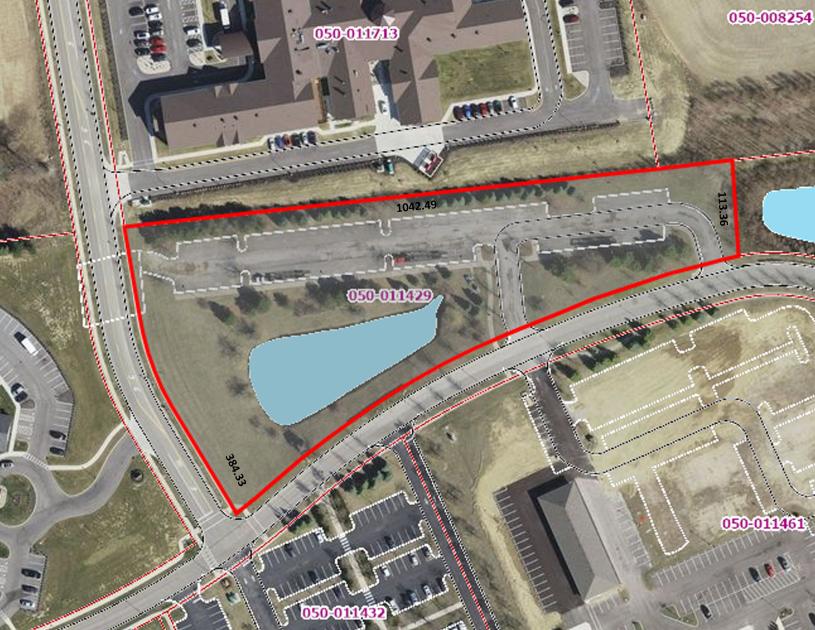
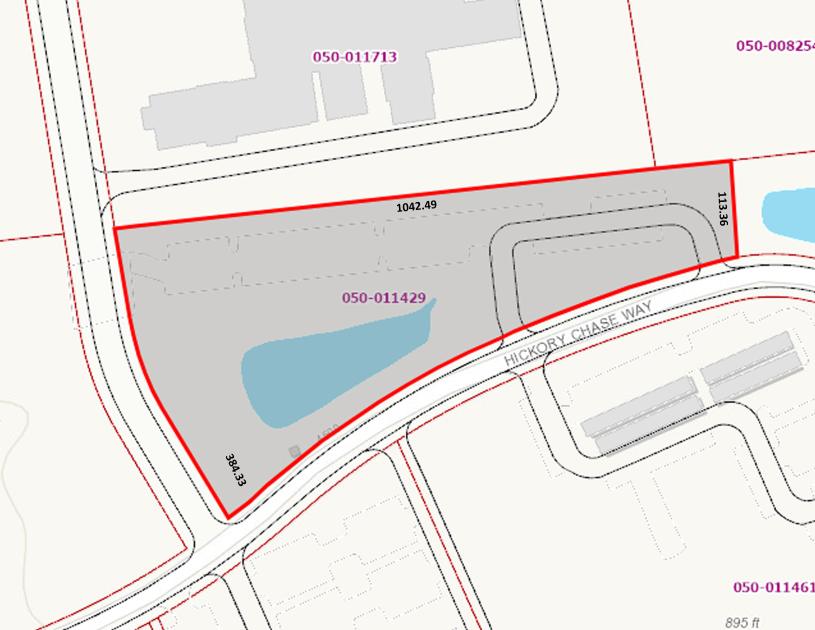
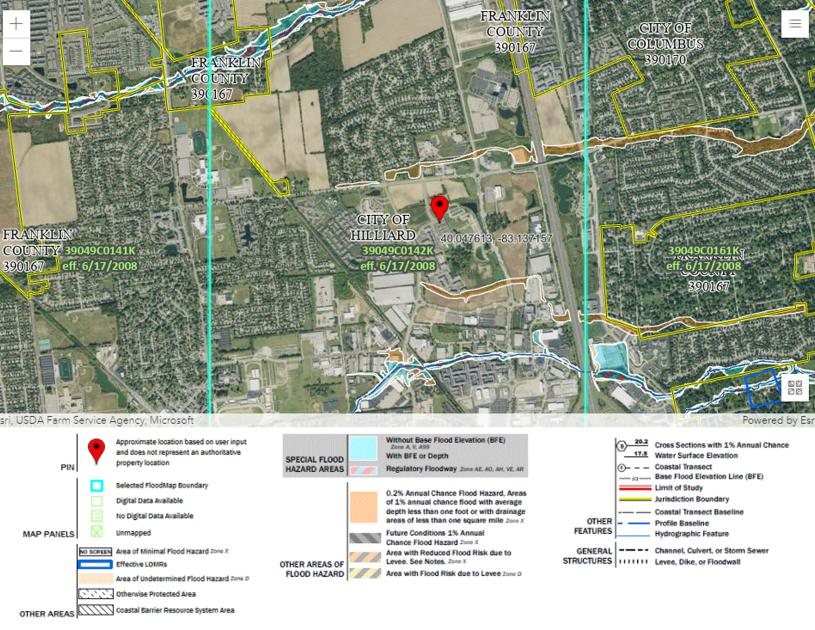
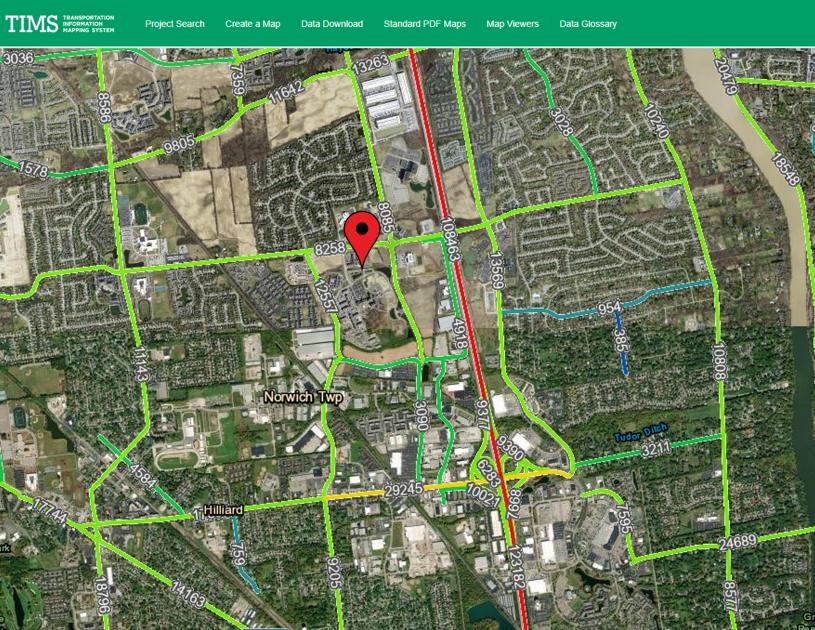
1-Mile | 3-Miles | 5-Miles | ||
---|---|---|---|---|
Total Population | 7,963 | 85,162 | 197,218 | |
Population Median Age | 35 | 37 | 37 | |
Population by Age | 0-9 Yrs | 1087 (13%) | 11291 (13%) | 25678 (13%) |
10-19 Yrs | 644 (8%) | 10496 (12%) | 23821 (12%) | |
20-29 Yrs | 1527 (19%) | 11864 (13%) | 27992 (14%) | |
30-39 Yrs | 1884 (23%) | 14501 (17%) | 34617 (17%) | |
40-49 Yrs | 793 (9%) | 11169 (13%) | 25497 (12%) | |
50-59 Yrs | 787 (9%) | 9976 (11%) | 23955 (12%) | |
60-69 Yrs | 778 (9%) | 8877 (10%) | 18974 (9%) | |
70+ Yrs | 464 (5%) | 6988 (8%) | 16684 (8%) | |
Median HH Income | $101,873 | $98,257 | $95,280 | |
Total Household Income | < 24K | 188 (5%) | 3000 (8%) | 7643 (9%) |
25-49K | 355 (10%) | 5112 (14%) | 12764 (15%) | |
50-74K | 667 (19%) | 5073 (14%) | 12542 (15%) | |
75-99K | 479 (13%) | 4898 (13%) | 10915 (13%) | |
100-199K | 1315 (38%) | 12126 (34%) | 26697 (31%) | |
200K+ | 447 (12%) | 5275 (14%) | 13047 (15%) | |
Highest Education Level | No Diploma | 93 | 2456 | 5600 |
Diploma or GED | 574 | 8599 | 18460 | |
Some College | 1019 | 9431 | 21741 | |
Assoc. Degree | 334 | 3906 | 8582 | |
Bachelors Degree | 2013 | 20900 | 49684 | |
Higher Degree | 1607 | 14296 | 33914 | |
Total Housing Units | 3,531 | 36,874 | 87,528 | |
--Owner-Occupied | 1,508 | 21,357 | 48,542 | |
--Renter-Occupied | 1,942 | 14,127 | 35,068 | |
Owner-Occupied Values | < 100K | 11 | 565 | 1543 |
100-199K | 71 | 3122 | 6902 | |
200-299K | 311 | 6256 | 13262 | |
300-399K | 638 | 5796 | 11973 | |
400-499K | 355 | 2816 | 6380 | |
500K+ | 122 | 2802 | 8481 | |
Total Working Age Population | 6,497 | 66,625 | 155,709 | |
In Work Force | 5,332 | 48,836 | 113,894 | |
Not In Work Force | 1,165 | 17,789 | 41,815 | |
Workforce Employed | 5,198 | 47,263 | 110,207 | |
Workforce Unemployed | 110 | 1,478 | 3,550 | |
Civlian Workforce | 5,308 | 48,742 | 113,757 | |
Military Workforce | 24 | 94 | 137 | |
Total Households | 3,451 | 35,484 | 83,610 | |
Family Households | 2,106 | 22,256 | 49,925 | |
Non-Family Households | 1,345 | 13,228 | 33,685 | |
Married Couple | 1,740 | 18,010 | 40,208 | |
Other Family | 366 | 4,246 | 9,717 | |
Married w/Child | 651 | 7,932 | 18,845 | |
Single Male w/Child | 110 | 710 | 1,427 | |
Single Female w/Child | 124 | 1,920 | 4,183 |
Population Change Last Two Decades - Plus Projection
2000 | % | 2010 | % | 2020 | % | 2030 | |
---|---|---|---|---|---|---|---|
Ohio | 11,353,140 | +2 | 11,536,504 | +2 | 11,799,448 | -2 | 11,615,100 |
Madison County | 40,213 | +8 | 43,435 | +1 | 43,824 | +8 | 47,420 |
Franklin County | 1,068,978 | +9 | 1,163,414 | +14 | 1,323,807 | +5 | 1,394,980 |
Union County | 40,909 | +28 | 52,300 | +20 | 62,784 | +3 | 64,830 |
Total Working Age Population:
Total Households:
Total Working Age Population:
Total Households:
Total Working Age Population:
Total Households: