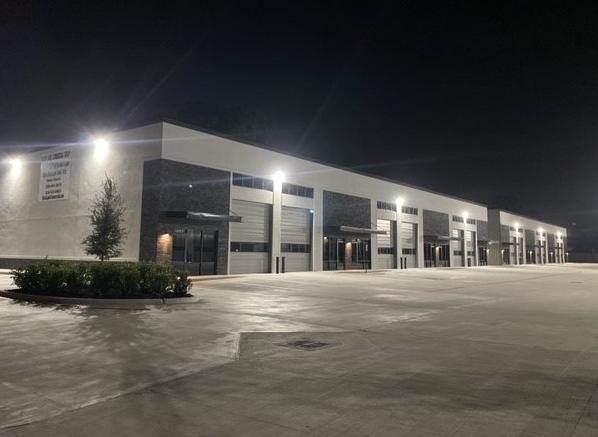
Industrial Properties
23637 Gosling Road Spring, TX 77389
23637 Gosling Road Spring, TX 77389
Details & Description
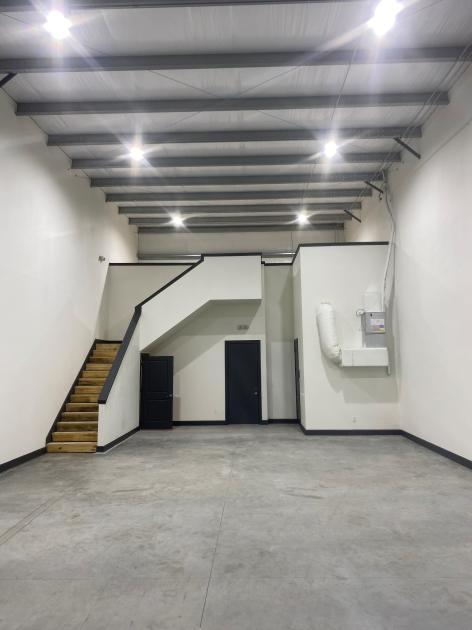
Property Highlights
- • 3 Phase power
- • 24' Clear height
- • LED lighting throughout
- • Insulated shells
Listing Agents

Stratton Butaud
O: 936-441-2610
M: 936-232-9357
stratton@blacklabelcommercial.com
O: 936-441-2610
M: 936-232-9357
stratton@blacklabelcommercial.com

Beau Harris
M: 936-523-0483
beau@blacklabelcommercial.com
M: 936-523-0483
beau@blacklabelcommercial.com
While we strive to provide the most accurate information, all listing information, and demographic data, is provided by third-parties. As such, MyEListing will not be responsible for the accuracy of the information. It is strongly recommended that you verify all information with the listing agent, and any relevant agencies, prior to making any decisions.