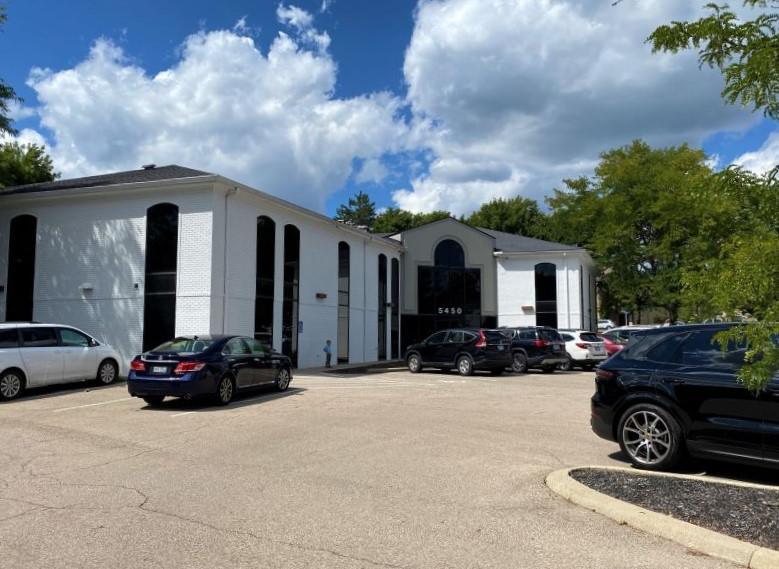
1-Mile | 3-Miles | 5-Miles | ||
---|---|---|---|---|
Total Population | 7,354 | 77,077 | 197,436 | |
Population Median Age | 45 | 43 | 40 | |
Population by Age | 0-9 Yrs | 833 (11%) | 8686 (11%) | 21617 (10%) |
10-19 Yrs | 693 (9%) | 8142 (10%) | 25763 (13%) | |
20-29 Yrs | 572 (7%) | 9649 (12%) | 27356 (13%) | |
30-39 Yrs | 1056 (14%) | 10109 (13%) | 26164 (13%) | |
40-49 Yrs | 654 (8%) | 7597 (9%) | 21831 (11%) | |
50-59 Yrs | 1021 (13%) | 10014 (12%) | 23965 (12%) | |
60-69 Yrs | 1001 (13%) | 9208 (11%) | 23478 (11%) | |
70+ Yrs | 1523 (20%) | 13671 (17%) | 27262 (13%) | |
Median HH Income | $84,661 | $75,816 | $73,814 | |
Total Household Income | < 24K | 283 (8%) | 4470 (12%) | 12471 (14%) |
25-49K | 676 (20%) | 6926 (19%) | 16513 (19%) | |
50-74K | 506 (15%) | 5758 (16%) | 14152 (16%) | |
75-99K | 481 (14%) | 5537 (15%) | 12504 (14%) | |
100-199K | 1006 (30%) | 9101 (26%) | 21514 (25%) | |
200K+ | 348 (10%) | 2877 (8%) | 7790 (9%) | |
Highest Education Level | No Diploma | 178 | 2329 | 7050 |
Diploma or GED | 1120 | 10827 | 27861 | |
Some College | 1110 | 12294 | 29234 | |
Assoc. Degree | 423 | 5480 | 13119 | |
Bachelors Degree | 1547 | 14236 | 33525 | |
Higher Degree | 1224 | 11154 | 25372 | |
Total Housing Units | 3,435 | 36,519 | 90,401 | |
--Owner-Occupied | 2,620 | 23,370 | 54,943 | |
--Renter-Occupied | 680 | 11,300 | 30,002 | |
Owner-Occupied Values | < 100K | 79 | 1895 | 8080 |
100-199K | 748 | 8588 | 19984 | |
200-299K | 1187 | 8079 | 15318 | |
300-399K | 421 | 2743 | 6291 | |
400-499K | 114 | 1049 | 2752 | |
500K+ | 72 | 1017 | 2517 | |
Total Working Age Population | 6,083 | 63,142 | 161,586 | |
In Work Force | 3,729 | 40,258 | 103,015 | |
Not In Work Force | 2,354 | 22,884 | 58,570 | |
Workforce Employed | 3,659 | 38,718 | 98,215 | |
Workforce Unemployed | 33 | 1,197 | 4,036 | |
Civlian Workforce | 3,692 | 39,915 | 102,251 | |
Military Workforce | 37 | 343 | 764 | |
Total Households | 3,301 | 34,670 | 84,945 | |
Family Households | 2,148 | 20,275 | 49,026 | |
Non-Family Households | 1,153 | 14,395 | 35,918 | |
Married Couple | 1,824 | 16,148 | 37,853 | |
Other Family | 324 | 4,127 | 11,174 | |
Married w/Child | 599 | 5,668 | 13,800 | |
Single Male w/Child | 54 | 416 | 1,733 | |
Single Female w/Child | 122 | 1,785 | 4,836 |
Population Change Last Two Decades - Plus Projection
2000 | % | 2010 | % | 2020 | % | 2030 | |
---|---|---|---|---|---|---|---|
Ohio | 11,353,140 | +2 | 11,536,504 | +2 | 11,799,448 | -2 | 11,615,100 |
Greene County | 147,886 | +9 | 161,573 | +4 | 167,966 | -1 | 165,780 |
Montgomery County | 559,062 | -4 | 535,153 | 0 | 537,309 | -8 | 496,650 |
Total Working Age Population:
Total Households:
Total Working Age Population:
Total Households:
Total Working Age Population:
Total Households: