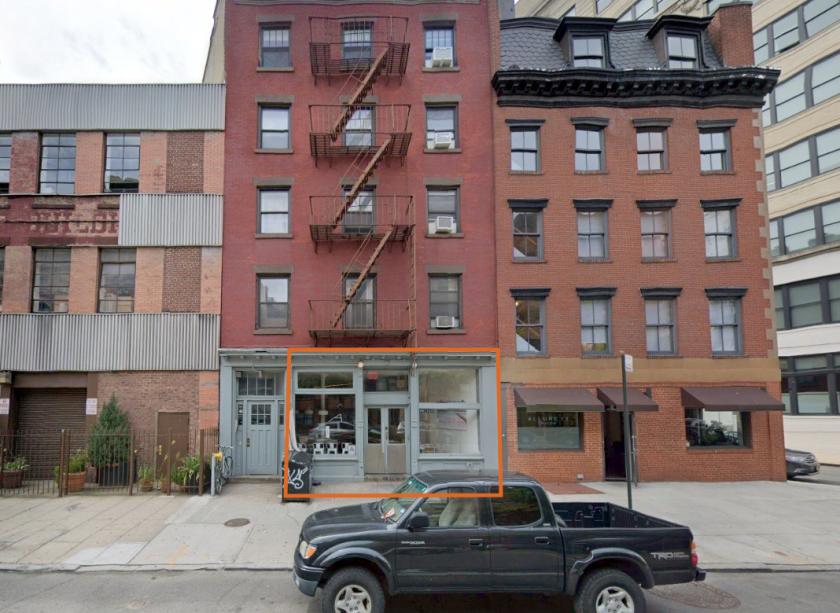
Retail Space
306 West 13th Street New York, NY 10014
306 West 13th Street New York, NY 10014
Details & Description
Property Highlights
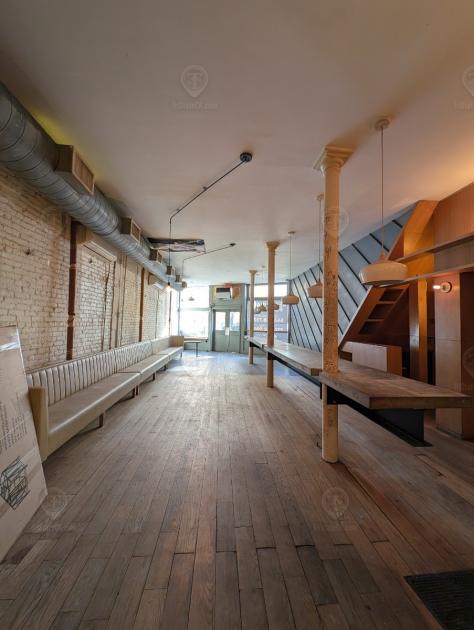
- • 2nd generation wine bar
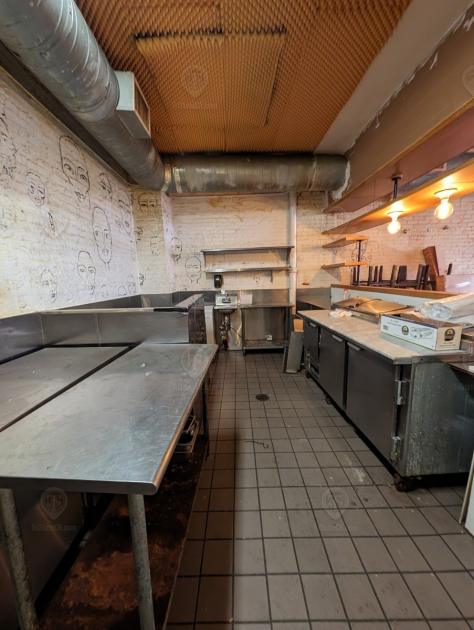
- • Electric kitchen in place
- • 25 ft of frontage
- • 10.5 ft ceilings
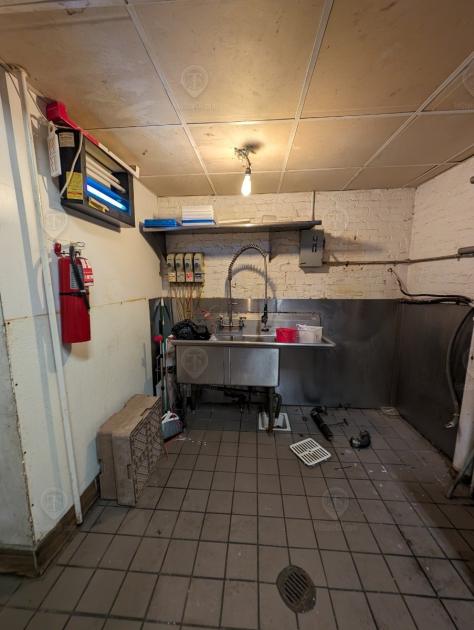
- • Full basement for storage
Additional Photos

Listing Agents

Shlomi Bagdadi
O: 718-437-6100
info@tristatecr.com
O: 718-437-6100
info@tristatecr.com
While we strive to provide the most accurate information, all listing information, and demographic data, is provided by third-parties. As such, MyEListing will not be responsible for the accuracy of the information. It is strongly recommended that you verify all information with the listing agent, and any relevant agencies, prior to making any decisions.


