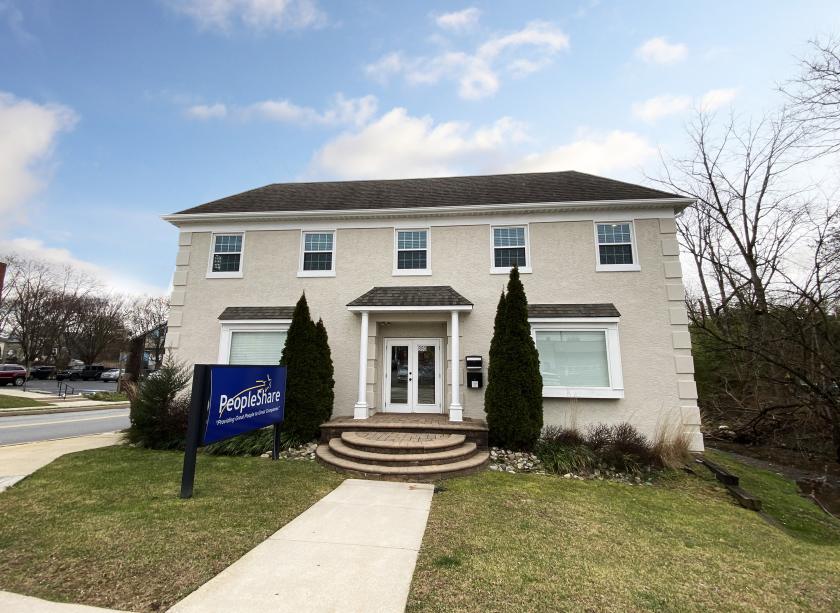
1-Mile | 3-Miles | 5-Miles | ||
---|---|---|---|---|
Total Population | 20,392 | 60,015 | 111,398 | |
Population Median Age | 32 | 38 | 40 | |
Population by Age | 0-9 Yrs | 987 (4%) | 4816 (8%) | 10023 (8%) |
10-19 Yrs | 4964 (24%) | 10147 (16%) | 16089 (14%) | |
20-29 Yrs | 6544 (32%) | 12017 (20%) | 17599 (15%) | |
30-39 Yrs | 2276 (11%) | 7284 (12%) | 13596 (12%) | |
40-49 Yrs | 1583 (7%) | 5586 (9%) | 11458 (10%) | |
50-59 Yrs | 1414 (6%) | 6942 (11%) | 14067 (12%) | |
60-69 Yrs | 1333 (6%) | 7130 (11%) | 14400 (12%) | |
70+ Yrs | 1291 (6%) | 6095 (10%) | 14166 (12%) | |
Median HH Income | $73,747 | $96,212 | $115,418 | |
Total Household Income | < 24K | 1259 (16%) | 2737 (11%) | 4060 (9%) |
25-49K | 1352 (18%) | 2833 (12%) | 4527 (10%) | |
50-74K | 1158 (15%) | 3297 (14%) | 5438 (12%) | |
75-99K | 1216 (16%) | 3097 (13%) | 5149 (11%) | |
100-199K | 1585 (21%) | 6294 (27%) | 13190 (30%) | |
200K+ | 863 (11%) | 4733 (20%) | 10871 (25%) | |
Highest Education Level | No Diploma | 491 | 886 | 1717 |
Diploma or GED | 2242 | 6387 | 11508 | |
Some College | 1244 | 5221 | 9658 | |
Assoc. Degree | 400 | 1810 | 3792 | |
Bachelors Degree | 3529 | 14379 | 28729 | |
Higher Degree | 1972 | 8349 | 19130 | |
Total Housing Units | 7,901 | 23,840 | 44,762 | |
--Owner-Occupied | 2,623 | 13,723 | 29,562 | |
--Renter-Occupied | 4,811 | 9,270 | 13,673 | |
Owner-Occupied Values | < 100K | 43 | 237 | 630 |
100-199K | 57 | 556 | 937 | |
200-299K | 300 | 1100 | 2379 | |
300-399K | 546 | 2001 | 4625 | |
400-499K | 695 | 2925 | 5807 | |
500K+ | 982 | 6902 | 15184 | |
Total Working Age Population | 18,674 | 51,439 | 94,370 | |
In Work Force | 12,444 | 35,153 | 62,763 | |
Not In Work Force | 6,229 | 16,286 | 31,607 | |
Workforce Employed | 11,582 | 33,519 | 59,964 | |
Workforce Unemployed | 859 | 1,608 | 2,753 | |
Civlian Workforce | 12,442 | 35,127 | 62,718 | |
Military Workforce | 3 | 26 | 45 | |
Total Households | 7,434 | 22,993 | 43,235 | |
Family Households | 2,700 | 12,637 | 26,948 | |
Non-Family Households | 4,734 | 10,356 | 16,287 | |
Married Couple | 1,788 | 10,640 | 23,102 | |
Other Family | 912 | 1,997 | 3,847 | |
Married w/Child | 618 | 3,952 | 8,547 | |
Single Male w/Child | 41 | 253 | 586 | |
Single Female w/Child | 348 | 696 | 1,155 |
Population Change Last Two Decades - Plus Projection
2000 | % | 2010 | % | 2020 | % | 2030 | |
---|---|---|---|---|---|---|---|
Pennsylvania | 12,281,054 | +3 | 12,702,379 | +2 | 13,002,700 | +6 | 13,759,594 |
Chester County | 433,501 | +15 | 498,886 | +7 | 534,413 | +7 | 573,576 |
Delaware County | 550,864 | +1 | 558,979 | +3 | 576,830 | +8 | 622,307 |
Total Working Age Population:
Total Households:
Total Working Age Population:
Total Households:
Total Working Age Population:
Total Households: