Industrial Properties
16708 Picadilly Court Round Rock, TX 78664
16708 Picadilly Court Round Rock, TX 78664
Details & Description
Property Highlights
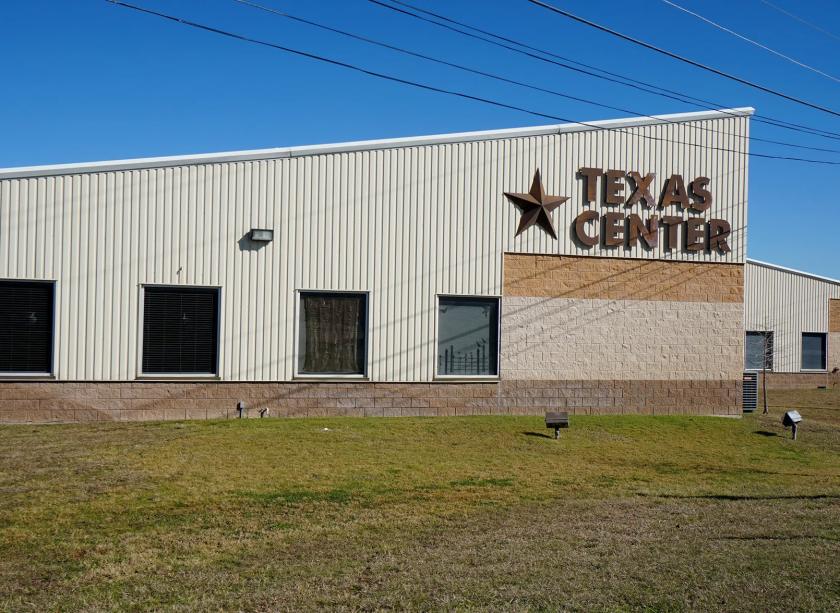
• Located within the City of Pflugerville, approx. one mile east of IH-35 in the Springbrook Industrial Park
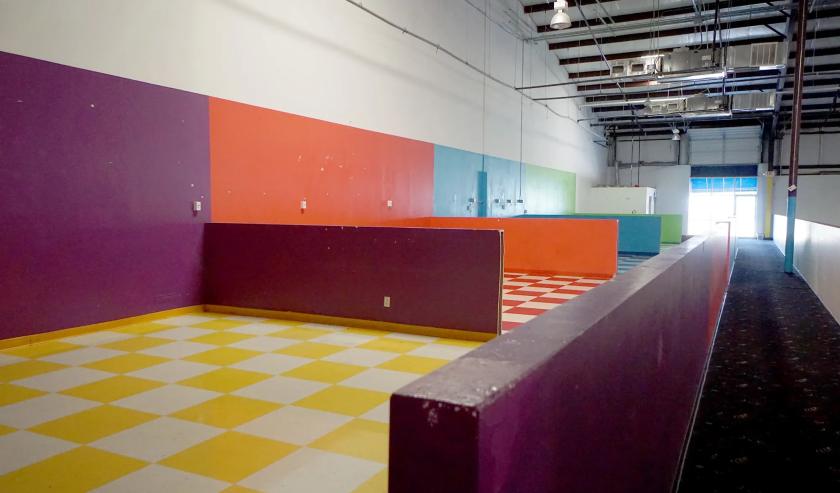
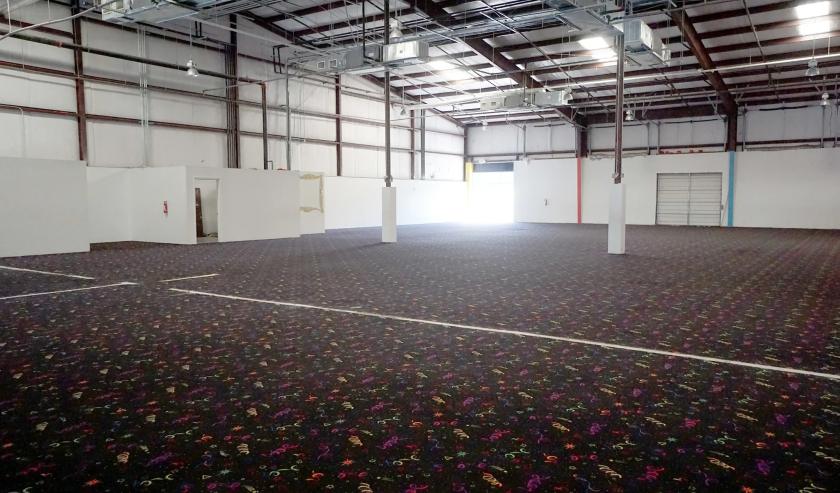
• 36,000 SF Multi-Tenant Industrial Building on 2 AC Lot For Lease
Listing Agents

Darren Quick
O: 512-814-1820
darren@donquick.com
O: 512-814-1820
darren@donquick.com
While we strive to provide the most accurate information, all listing information, and demographic data, is provided by third-parties. As such, MyEListing will not be responsible for the accuracy of the information. It is strongly recommended that you verify all information with the listing agent, and any relevant agencies, prior to making any decisions.