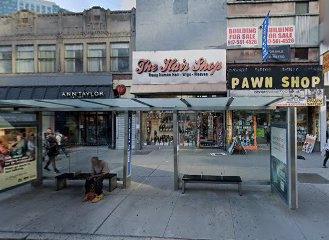
1-Mile | 3-Miles | 5-Miles | ||
---|---|---|---|---|
Total Population | 141,372 | 1,071,342 | 2,686,582 | |
Population Median Age | 37 | 37 | 37 | |
Population by Age | 0-9 Yrs | 17473 (12%) | 119050 (11%) | 304483 (11%) |
10-19 Yrs | 11690 (8%) | 102183 (9%) | 264901 (9%) | |
20-29 Yrs | 22110 (15%) | 193242 (18%) | 471219 (17%) | |
30-39 Yrs | 32432 (22%) | 223040 (20%) | 529913 (19%) | |
40-49 Yrs | 20503 (14%) | 139064 (12%) | 345069 (12%) | |
50-59 Yrs | 14523 (10%) | 114309 (10%) | 293369 (10%) | |
60-69 Yrs | 10381 (7%) | 88011 (8%) | 240185 (8%) | |
70+ Yrs | 12260 (8%) | 92443 (8%) | 237444 (8%) | |
Median HH Income | $146,805 | $104,983 | $94,091 | |
Total Household Income | < 24K | 8812 (13%) | 83294 (18%) | 197461 (17%) |
25-49K | 5647 (8%) | 53685 (11%) | 150880 (13%) | |
50-74K | 4858 (7%) | 45506 (9%) | 128160 (11%) | |
75-99K | 4078 (6%) | 40333 (8%) | 108943 (9%) | |
100-199K | 15982 (25%) | 113879 (24%) | 280776 (25%) | |
200K+ | 23724 (37%) | 123221 (26%) | 253183 (22%) | |
Highest Education Level | No Diploma | 7839 | 95553 | 260809 |
Diploma or GED | 9404 | 108052 | 355841 | |
Some College | 8195 | 73575 | 209047 | |
Assoc. Degree | 3469 | 32481 | 91008 | |
Bachelors Degree | 38561 | 269136 | 588603 | |
Higher Degree | 37934 | 201721 | 436181 | |
Total Housing Units | 69,076 | 508,147 | 1,255,159 | |
--Owner-Occupied | 19,868 | 110,393 | 284,574 | |
--Renter-Occupied | 43,234 | 349,526 | 834,828 | |
Owner-Occupied Values | < 100K | 580 | 3450 | 9851 |
100-199K | 282 | 1743 | 6129 | |
200-299K | 465 | 2045 | 7929 | |
300-399K | 385 | 2501 | 10811 | |
400-499K | 690 | 3025 | 14543 | |
500K+ | 17466 | 97630 | 235311 | |
Total Working Age Population | 116,505 | 890,962 | 2,219,314 | |
In Work Force | 86,039 | 621,751 | 1,521,740 | |
Not In Work Force | 30,466 | 269,211 | 697,575 | |
Workforce Employed | 80,690 | 582,497 | 1,422,576 | |
Workforce Unemployed | 5,315 | 38,985 | 98,507 | |
Civlian Workforce | 86,006 | 621,482 | 1,521,082 | |
Military Workforce | 33 | 269 | 657 | |
Total Households | 63,102 | 459,918 | 1,119,402 | |
Family Households | 29,709 | 214,474 | 556,575 | |
Non-Family Households | 33,393 | 245,444 | 562,827 | |
Married Couple | 21,690 | 143,642 | 363,671 | |
Other Family | 8,019 | 70,832 | 192,905 | |
Married w/Child | 9,822 | 60,863 | 152,356 | |
Single Male w/Child | 912 | 5,642 | 14,510 | |
Single Female w/Child | 2,657 | 21,895 | 59,337 |
Population Change Last Two Decades - Plus Projection
2000 | % | 2010 | % | 2020 | % | 2030 | |
---|---|---|---|---|---|---|---|
New Jersey | 8,414,350 | +4 | 8,791,894 | +6 | 9,288,994 | +3 | 9,530,900 |
Hudson County | 608,975 | +4 | 634,266 | +14 | 724,854 | +3 | 747,400 |
New York | 18,976,457 | +2 | 19,378,102 | +4 | 20,201,249 | +2 | 20,604,030 |
New York County | 1,537,195 | +3 | 1,585,873 | +7 | 1,694,251 | +2 | 1,727,631 |
Richmond County | 443,728 | +6 | 468,730 | +6 | 495,747 | -2 | 488,119 |
Queens County | 2,229,379 | 0 | 2,230,722 | +8 | 2,405,464 | +7 | 2,565,268 |
Kings County | 2,465,326 | +2 | 2,504,700 | +9 | 2,736,074 | +5 | 2,863,996 |
Total Working Age Population:
Total Households:
Total Working Age Population:
Total Households:
Total Working Age Population:
Total Households: