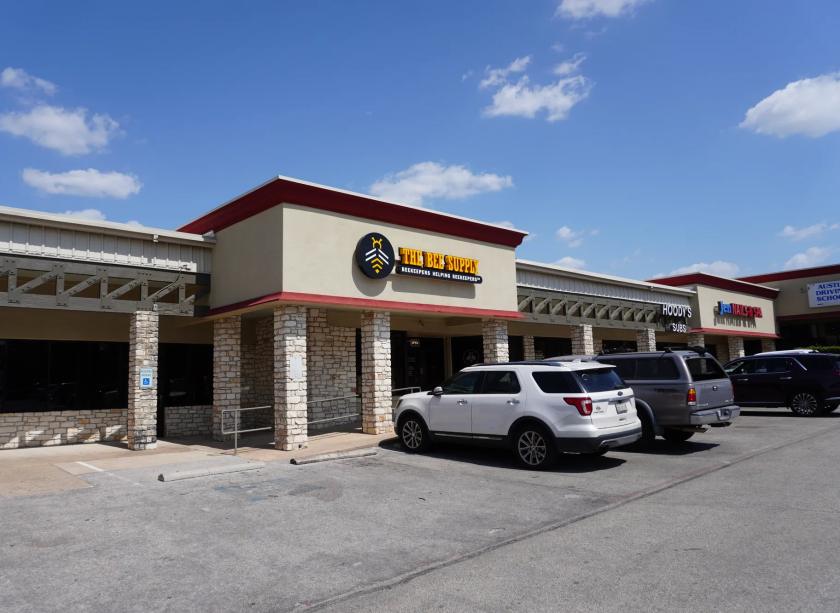
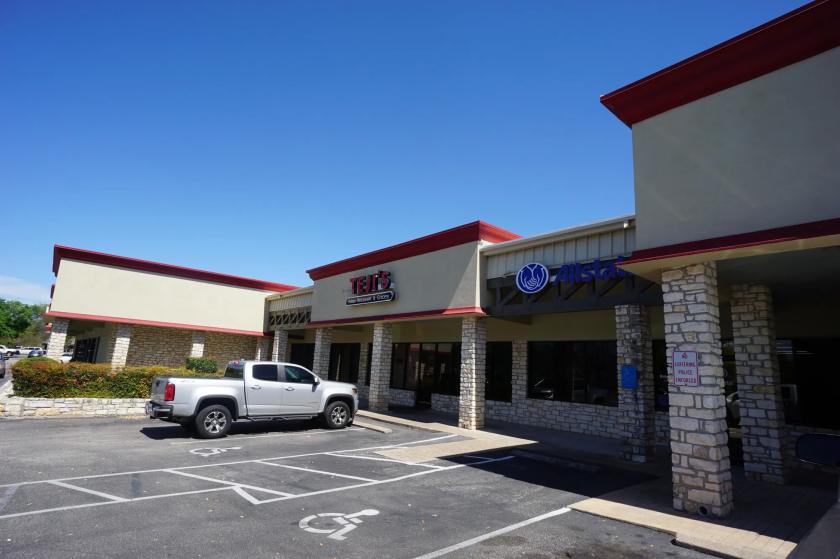
Retail Space
1205 Round Rock Avenue Round Rock, TX 78681
1205 Round Rock Avenue Round Rock, TX 78681
Details & Description
Property Highlights
• Located approximately 2.5 blocks west of IH-35 on RR 620, across from Round Rock High School
• Retail: Nail salon, martial arts school, and driving school
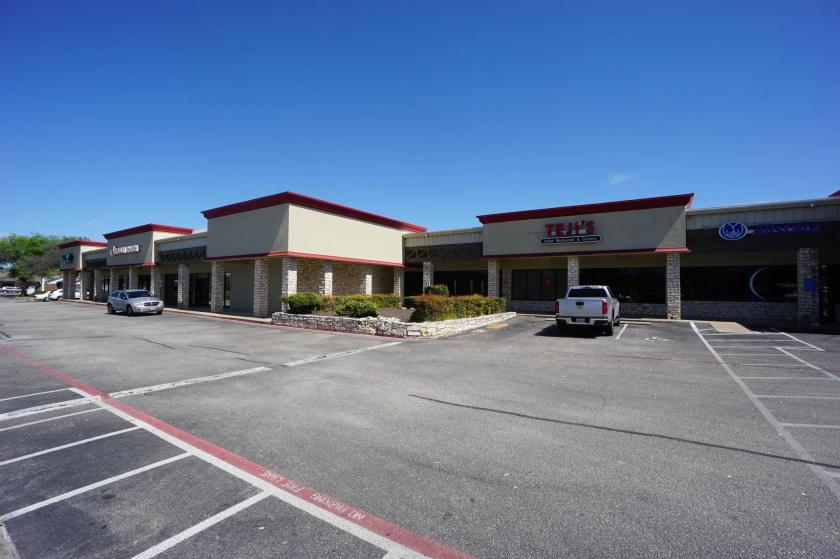
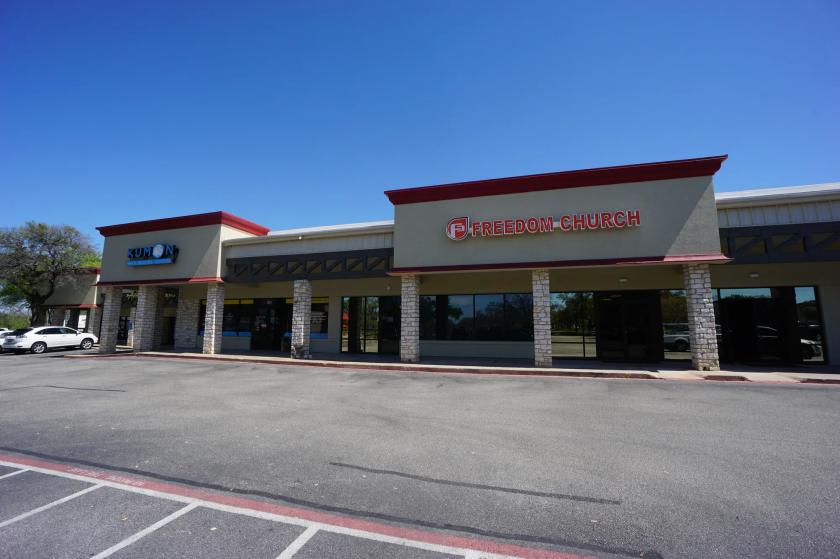
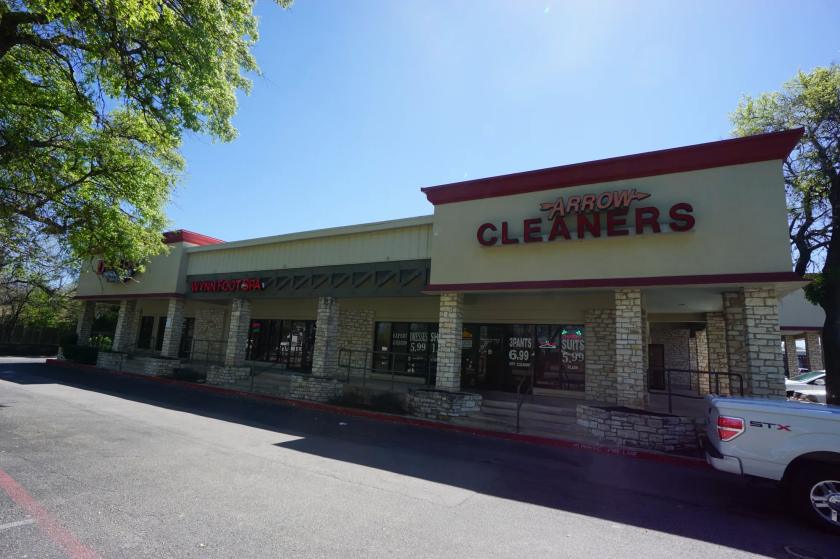
Additional Photos
Listing Agents

Darren Quick
O: 512-814-1820
darren@donquick.com
O: 512-814-1820
darren@donquick.com
While we strive to provide the most accurate information, all listing information, and demographic data, is provided by third-parties. As such, MyEListing will not be responsible for the accuracy of the information. It is strongly recommended that you verify all information with the listing agent, and any relevant agencies, prior to making any decisions.


