Flex-Office-Warehouse
1011 South Heatherwilde Boulevard Pflugerville, TX 78660
1011 South Heatherwilde Boulevard Pflugerville, TX 78660
Details & Description
Property Highlights
• Suite 220: 1,800 SF flex space. The suite has 500 SF of office space, a 12' OH door and 18' clear heig
• Suite 220: 1,800 SF flex space. The suite has 500 SF of office space, a 12' OH door and 18' clear heig
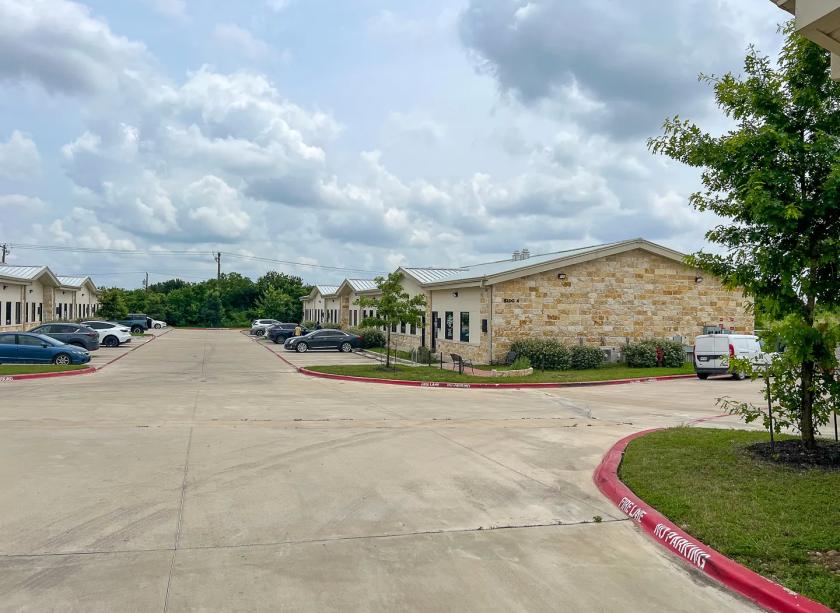
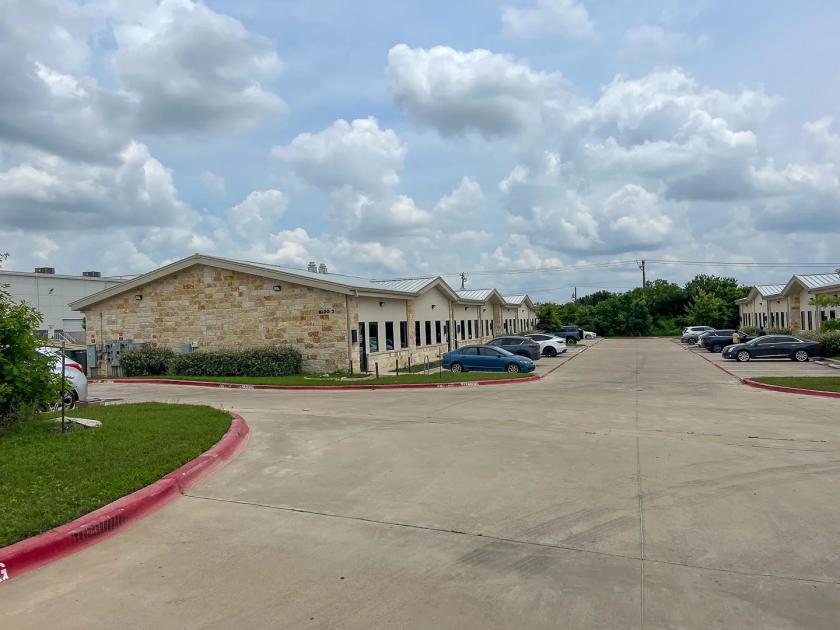
Additional Photos


Listing Agents

Darren Quick
O: 512-814-1820
darren@donquick.com
O: 512-814-1820
darren@donquick.com
While we strive to provide the most accurate information, all listing information, and demographic data, is provided by third-parties. As such, MyEListing will not be responsible for the accuracy of the information. It is strongly recommended that you verify all information with the listing agent, and any relevant agencies, prior to making any decisions.


