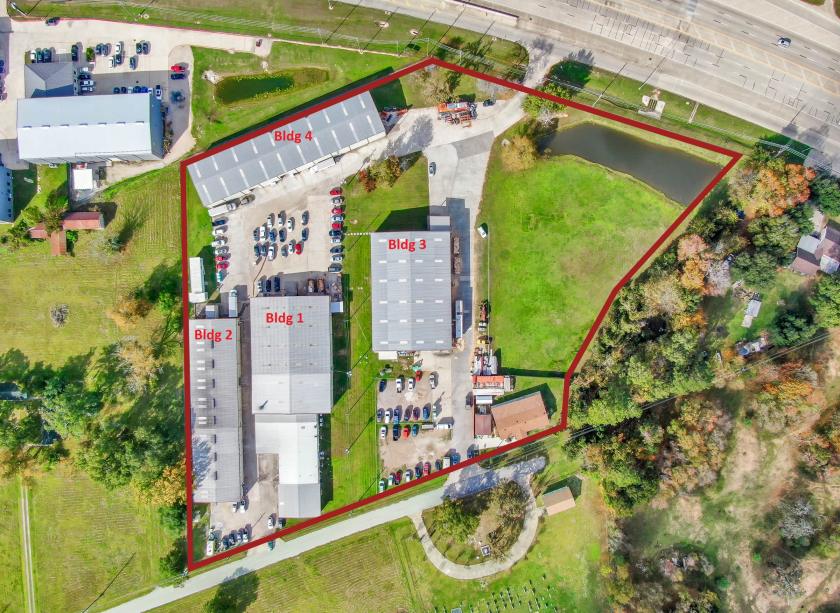
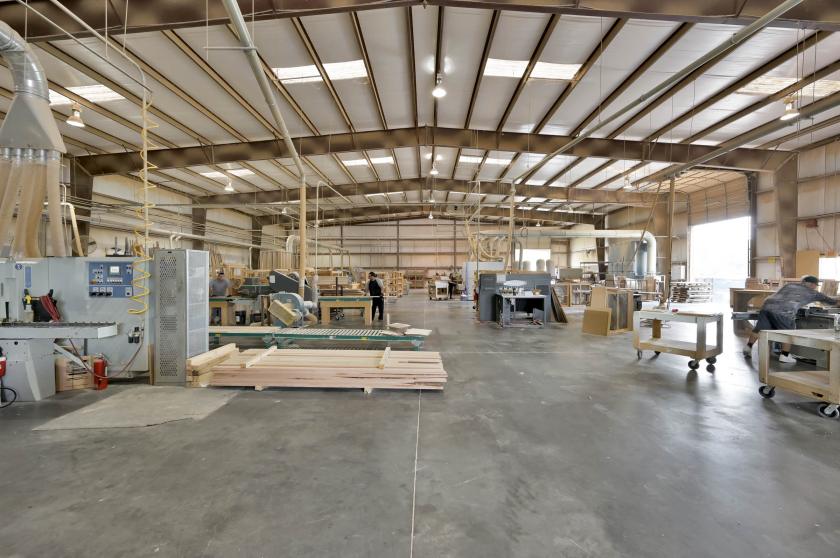
4 Bldgs. totaling 70,000sf. Situated on 7 Acres
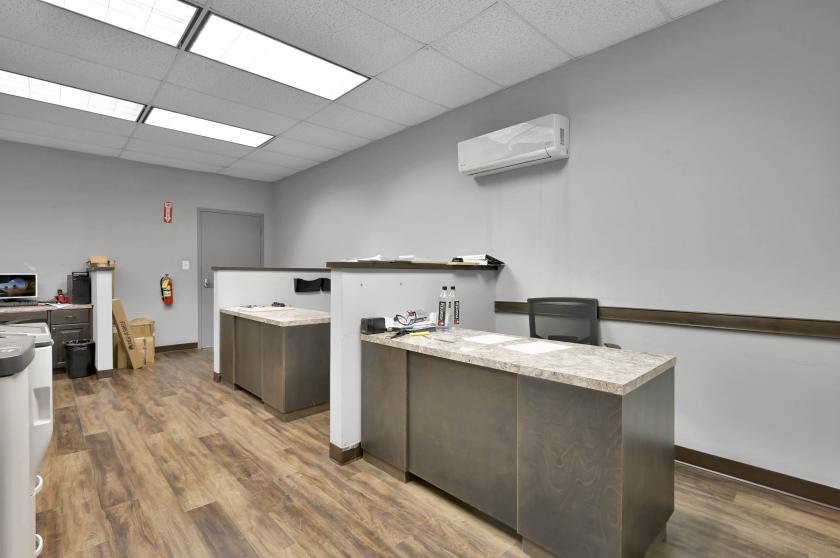
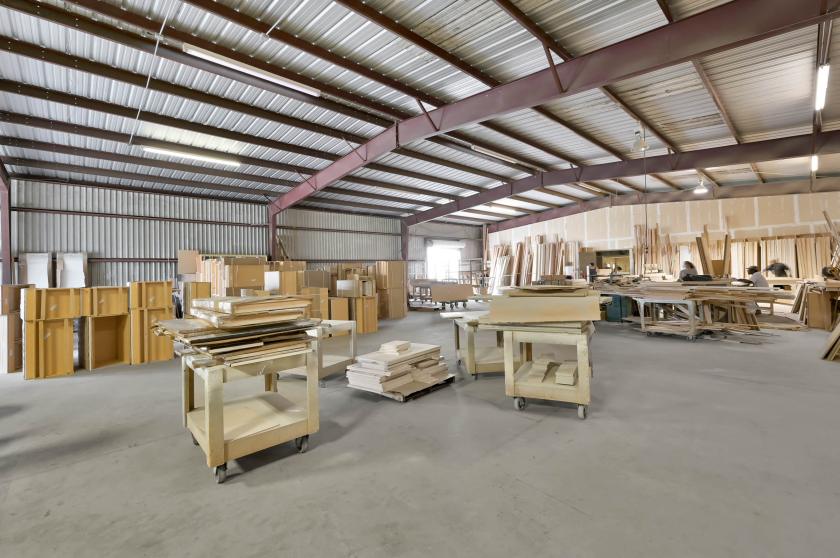
Bldg. 1 - 23,200sf , 3,800sf office, 12'-20' clear height, (2) dock high, (1) semi do
Bldg. 2 - 14,400sf , 500sf office, 16' clear height, (2) dock high, year built - 2000
Bldg. 3 - 15,000sf, shell, 22' clear height, (1) dock high, (2) grade level, year built - 2007
Bldg. 4 - 15,000sf, shell, 24' clear height, crane ready, year built – 2009. Bldgs. are insulated &
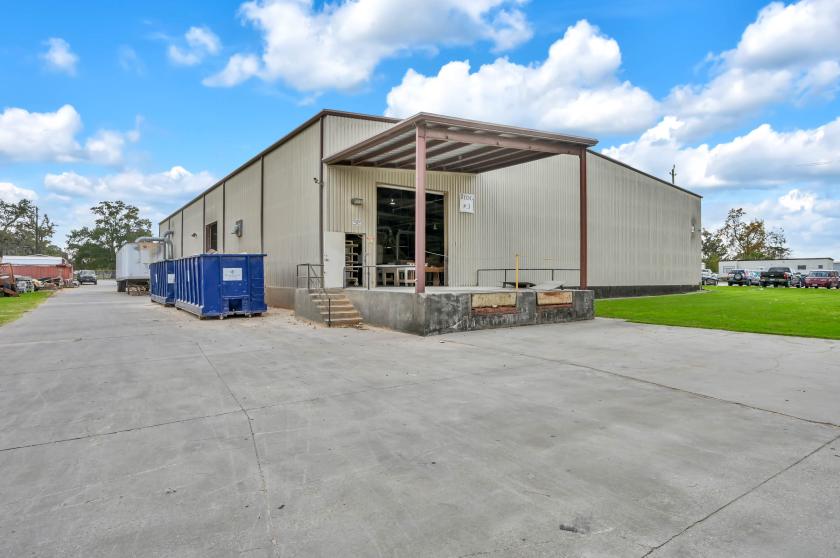
Fully Fenced and Gated
Room for additional buildings or stabilized outside storage
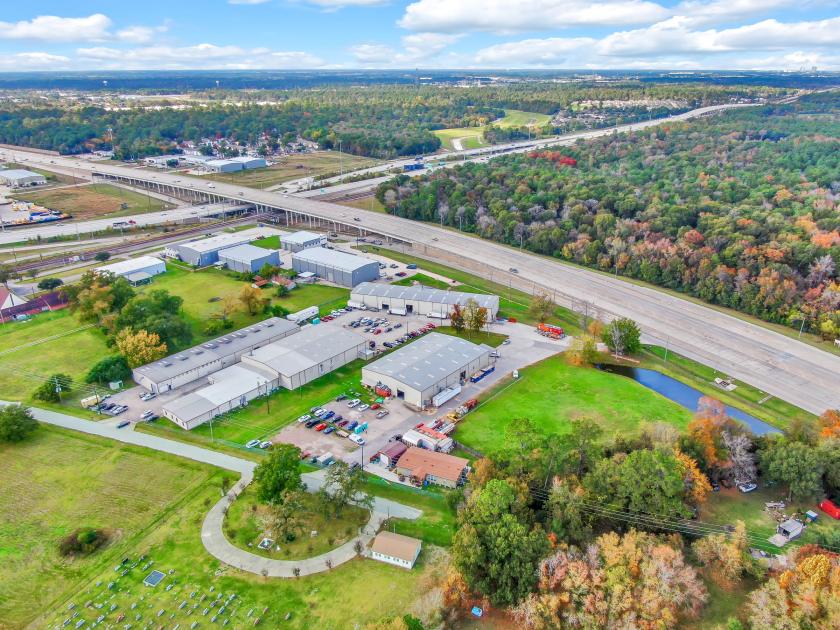
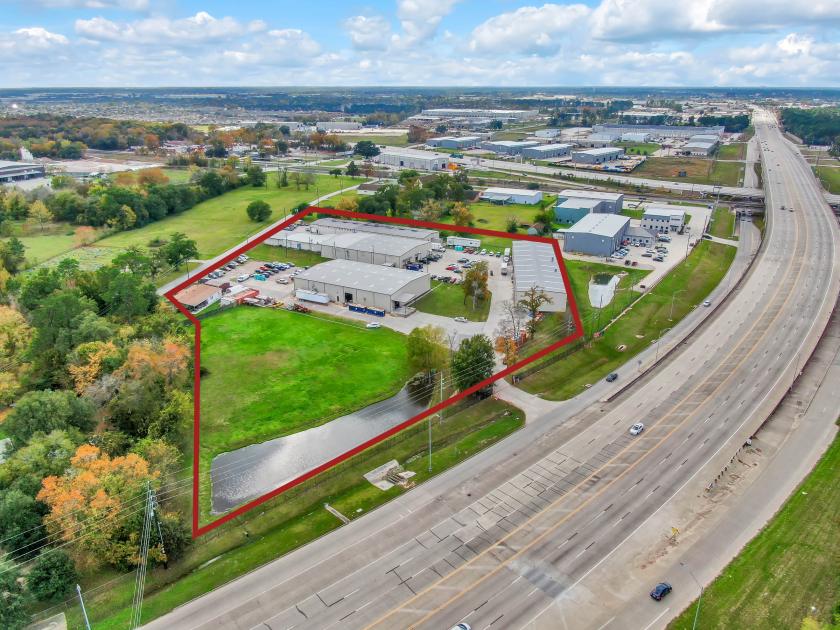
Great visibility from FM 1960
Great opportunity for end user or investors. Located at the intersection of Hardy Toll Rd & FM 1960 this industrial complex allows for easy access to Hardy Toll / I-45 / Grand Pkwy / BW 8. Access from both FM 1960 & Meyer Road.
No part of this information may be copied, reproduced, repurposed, or screen-captured for any commercial purpose without prior written authorization from MyEListing.
While we strive to provide the most accurate information, all listing information, and demographic data, is provided by third-parties. As such, MyEListing will not be responsible for the accuracy of the information. It is strongly recommended that you verify all information with the listing agent, and any relevant agencies, prior to making any decisions.
What is the asking price for 1720 Farm to Market 1960 in Houston?
The asking price for 1720 Farm to Market 1960 is $7,500,000
What is the building size of this Flex/Office Whs property in Houston, TX?
The size of the building/unit at 1720 Farm to Market 1960 in Houston is 70,000 square feet
How much land does the Houston, TX property at 1720 Farm to Market 1960 include?
1720 Farm to Market 1960 in Houston includes 7.000 acres of land
What is the population within 1 mile of 1720 Farm to Market 1960 in Houston?
The population within 1 mile of 1720 Farm to Market 1960 Houston, TX 77073 is 8,178 people.
Who do I contact for questions about 1720 Farm to Market 1960?
You should contact the listing agent,
Beau Harris, for any details regarding this commercial listing.