Specialty Real Estate
9903 Farm to Market 1960 Dayton, TX 77535
9903 Farm to Market 1960 Dayton, TX 77535
Details & Description
Property Highlights
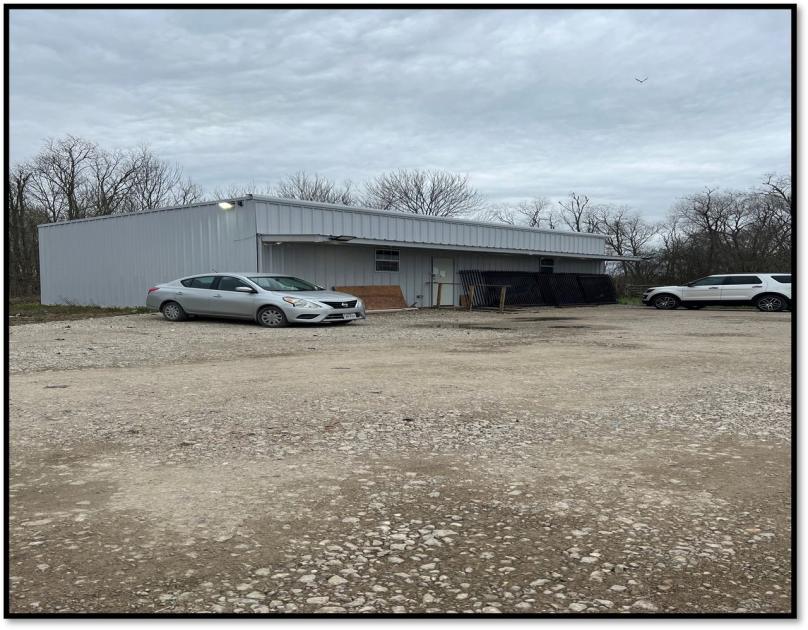
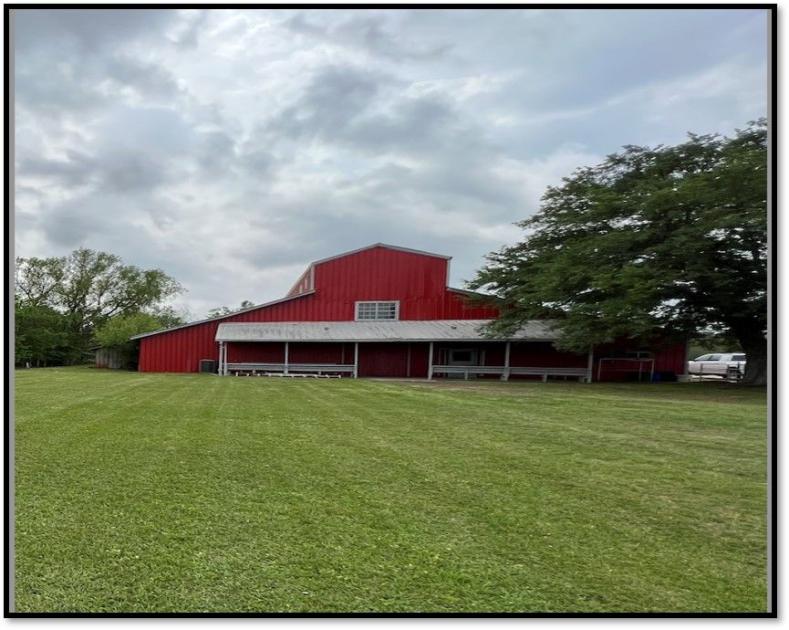
• +/- 5,500 SF Building On Site To Be Renovated & Leased As A Restaurant For RV Customer To Enjoy. (Est. $4,0
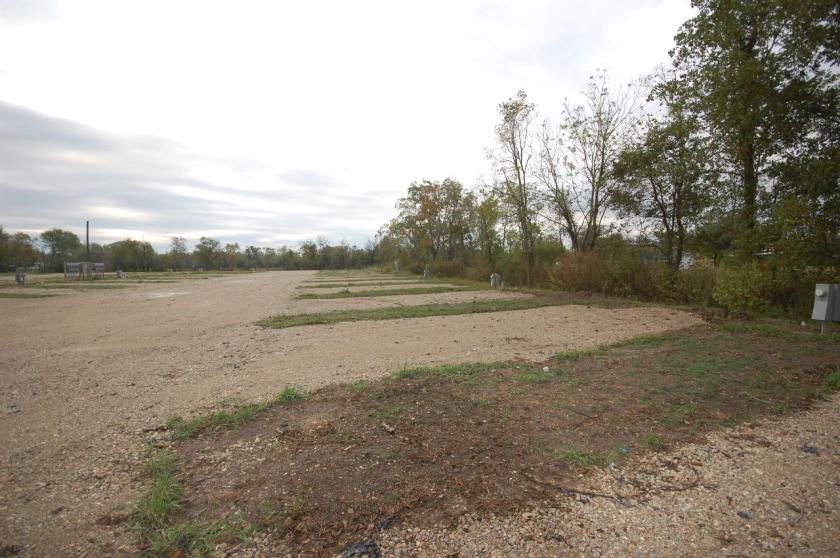
• Construction Was Completed May 1st And Current Owner Has Begun Taking Reservations($45 - Day, $150 - Week, $450
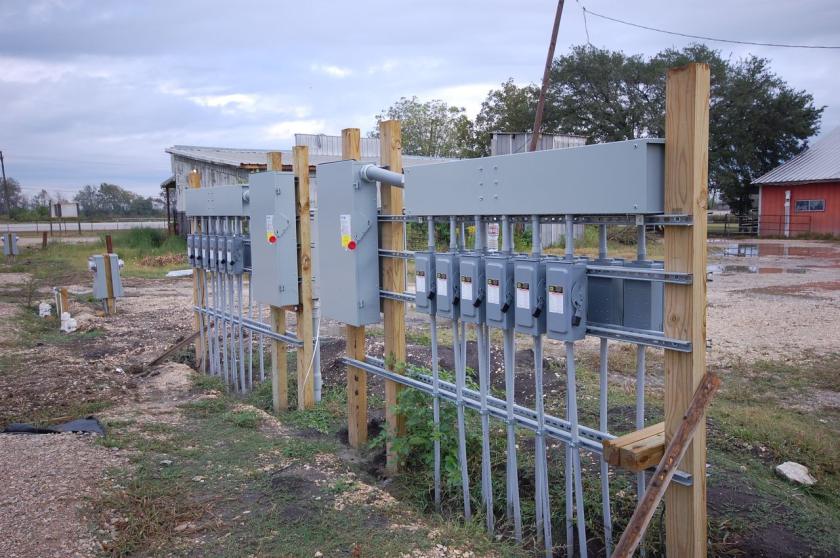
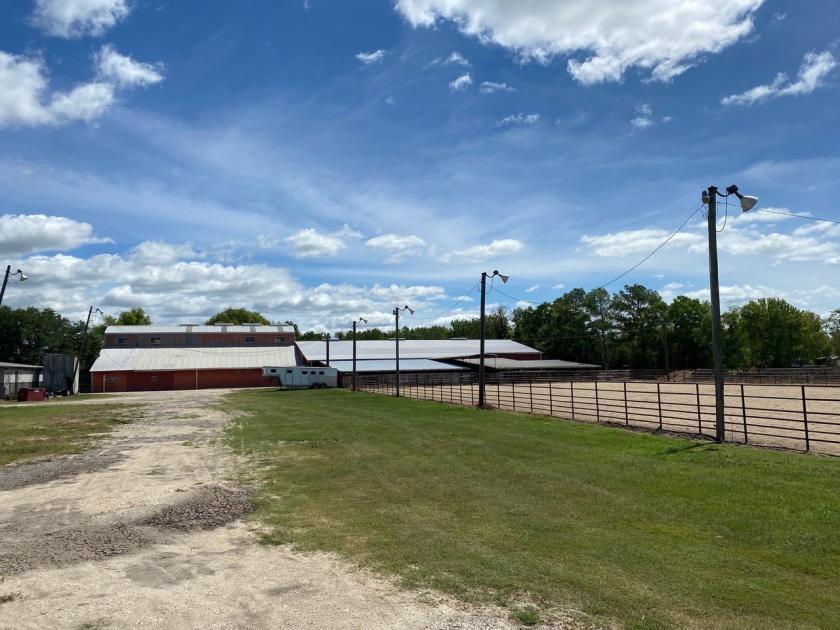
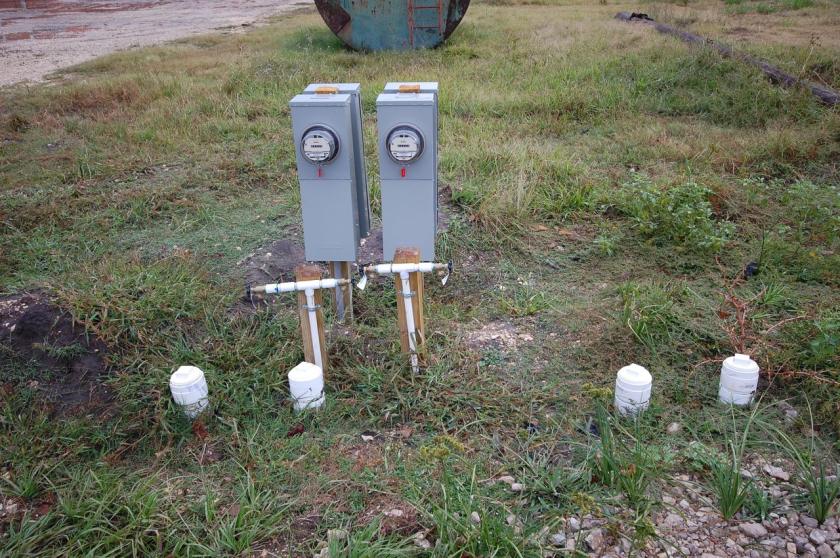
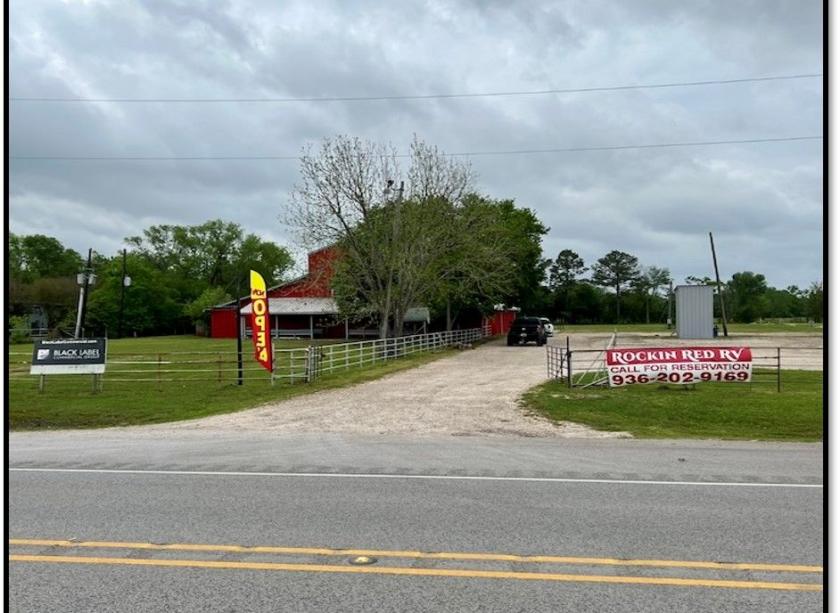
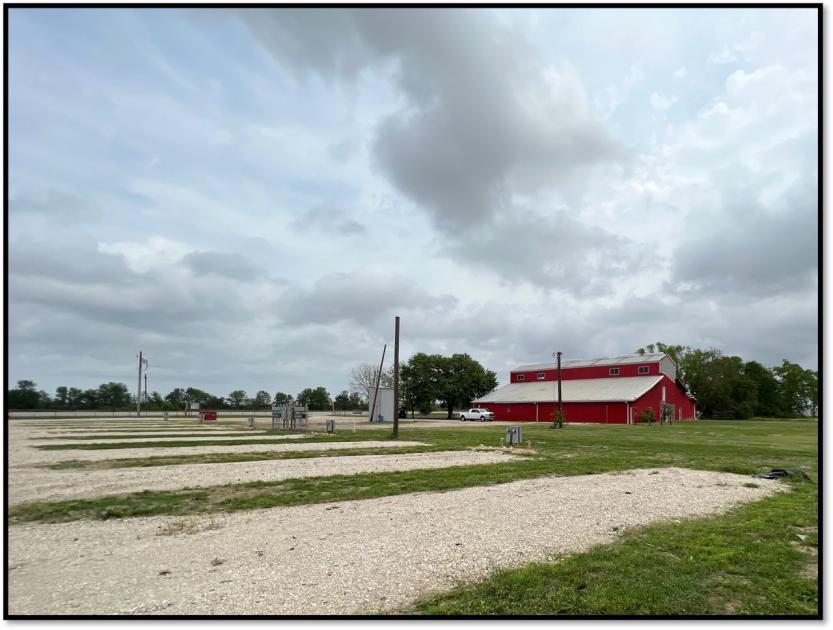
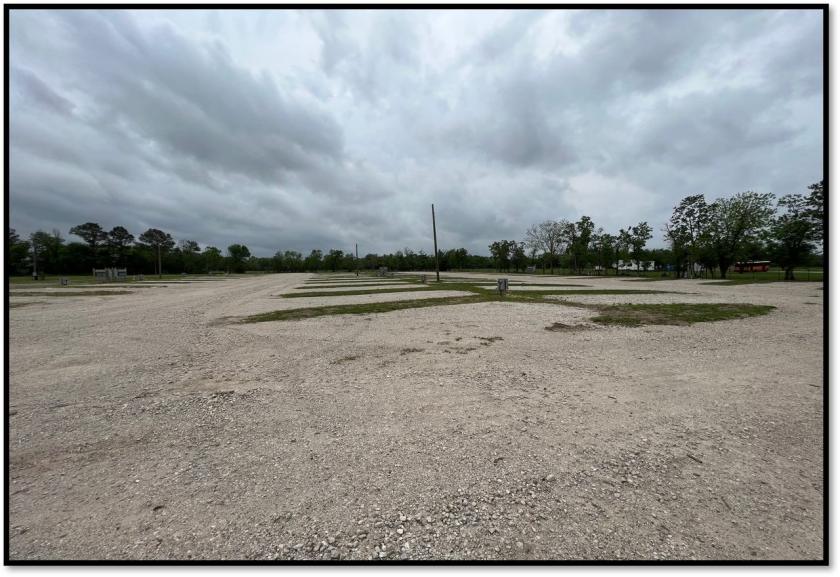
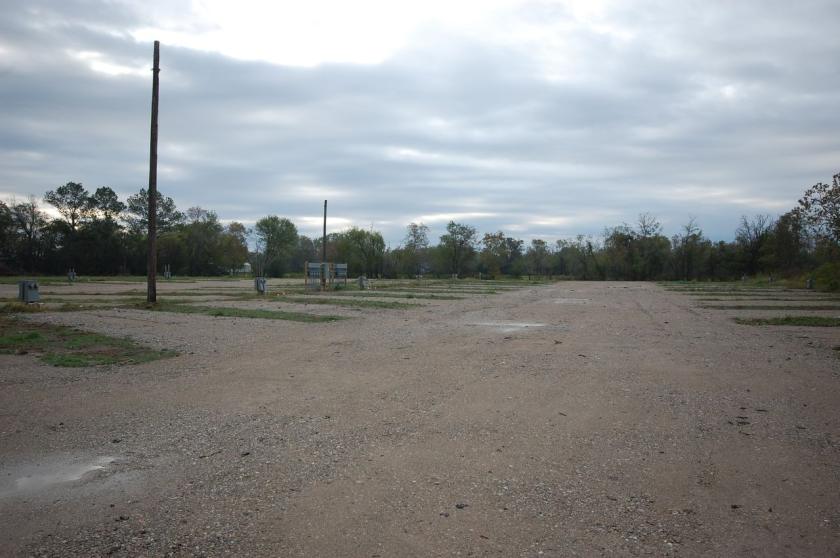
Additional Photos
Listing Agents

Hunter Spielman
M: 817-233-6663
hspielman@blacklabelcommercial.com
M: 817-233-6663
hspielman@blacklabelcommercial.com

Beau Harris
M: 936-523-0483
beau@blacklabelcommercial.com
M: 936-523-0483
beau@blacklabelcommercial.com
While we strive to provide the most accurate information, all listing information, and demographic data, is provided by third-parties. As such, MyEListing will not be responsible for the accuracy of the information. It is strongly recommended that you verify all information with the listing agent, and any relevant agencies, prior to making any decisions.