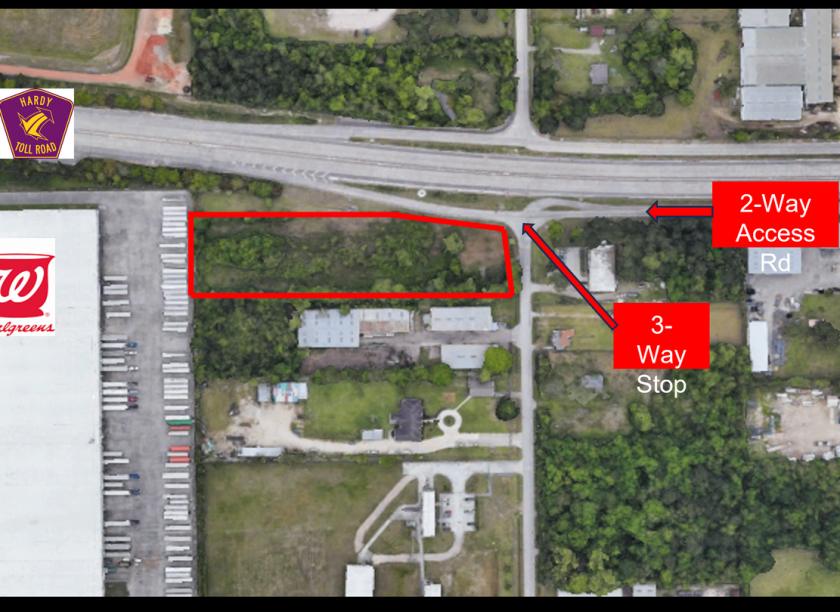
Commercial Land
16227 Waverly Drive Houston, TX 77032
16227 Waverly Drive Houston, TX 77032
Details & Description
Property Highlights
- • +/- 2.4 AC Of Raw Land (104,517 SF)
- • Situated On A Hard Corner
- • Zoned General Commercial
- • Dimensions ~630’ L x ~170’ W
- • PLEASE CONTACT BROKER FOR PRICING
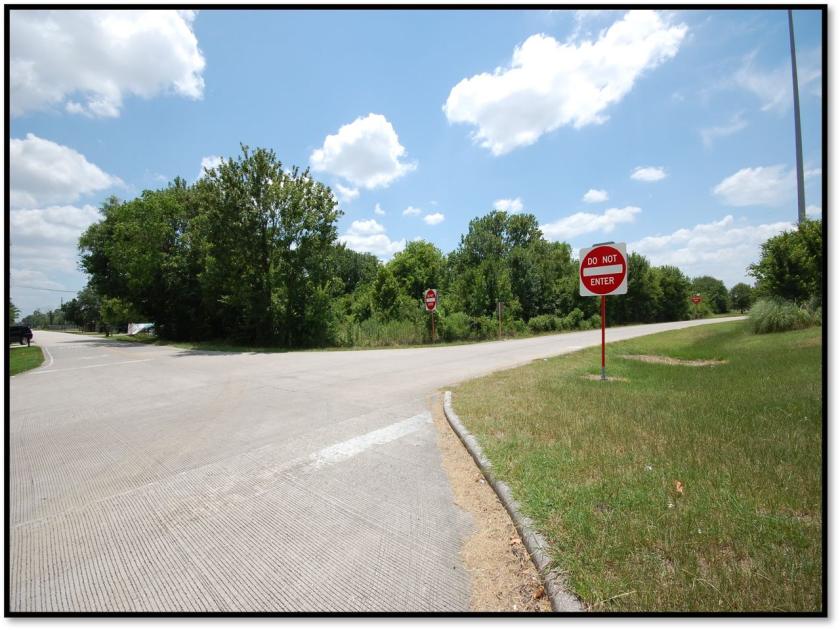
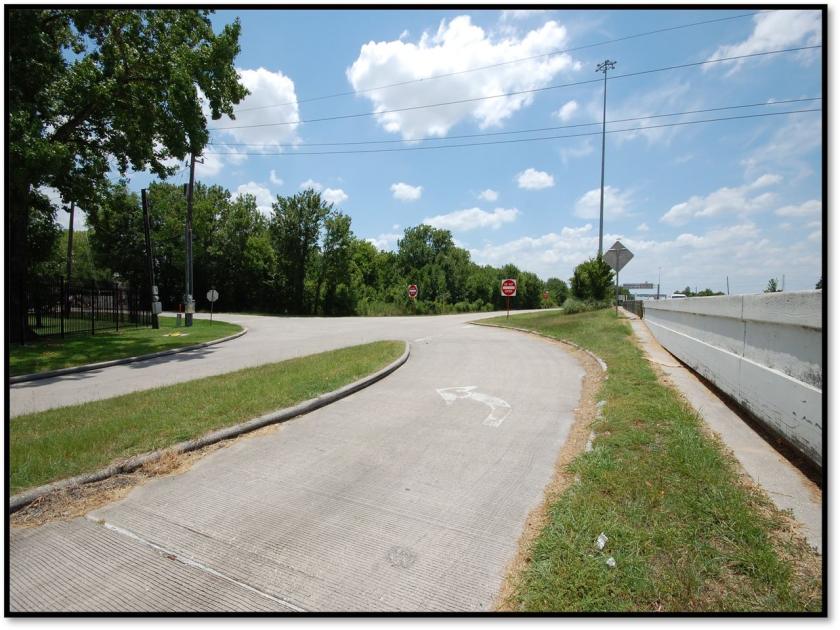
Additional Photos

Listing Agents

Hunter Spielman
M: 817-233-6663
hspielman@blacklabelcommercial.com
M: 817-233-6663
hspielman@blacklabelcommercial.com

Beau Harris
M: 936-523-0483
beau@blacklabelcommercial.com
M: 936-523-0483
beau@blacklabelcommercial.com
While we strive to provide the most accurate information, all listing information, and demographic data, is provided by third-parties. As such, MyEListing will not be responsible for the accuracy of the information. It is strongly recommended that you verify all information with the listing agent, and any relevant agencies, prior to making any decisions.


