Industrial Properties
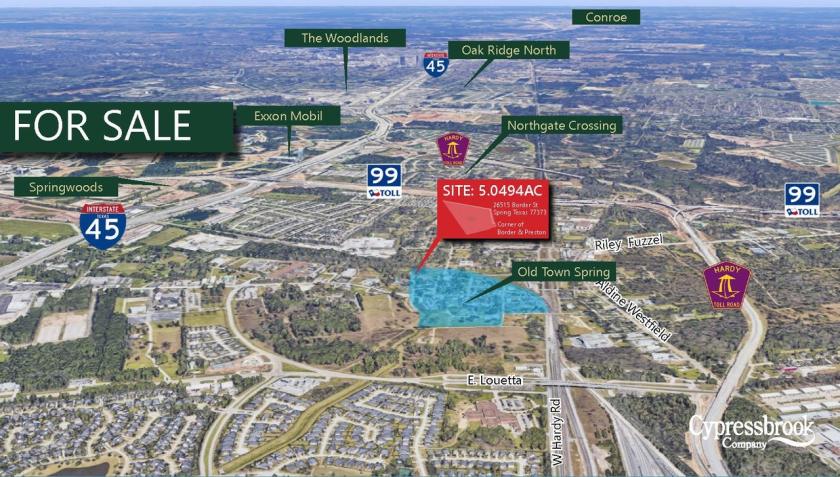
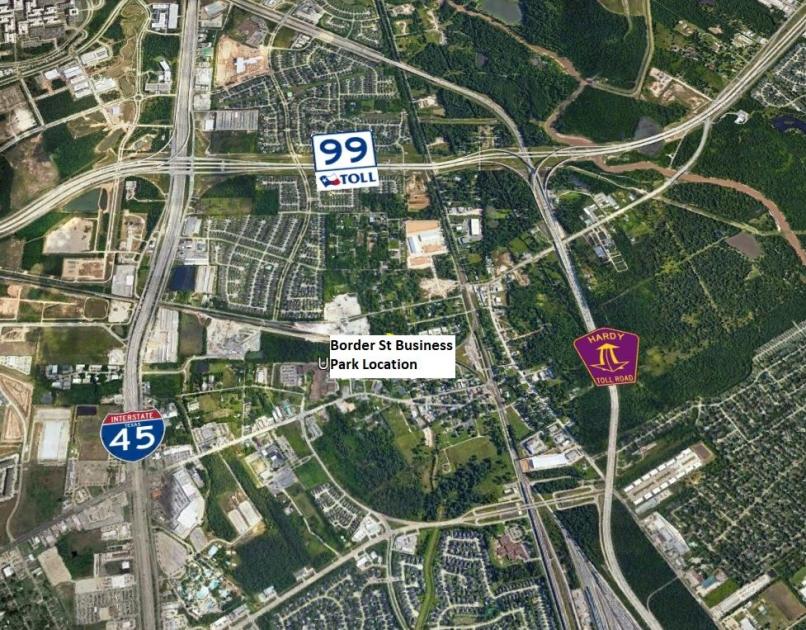
26515 Border Street Spring, TX 77373
26515 Border Street Spring, TX 77373
Details & Description
Property Highlights
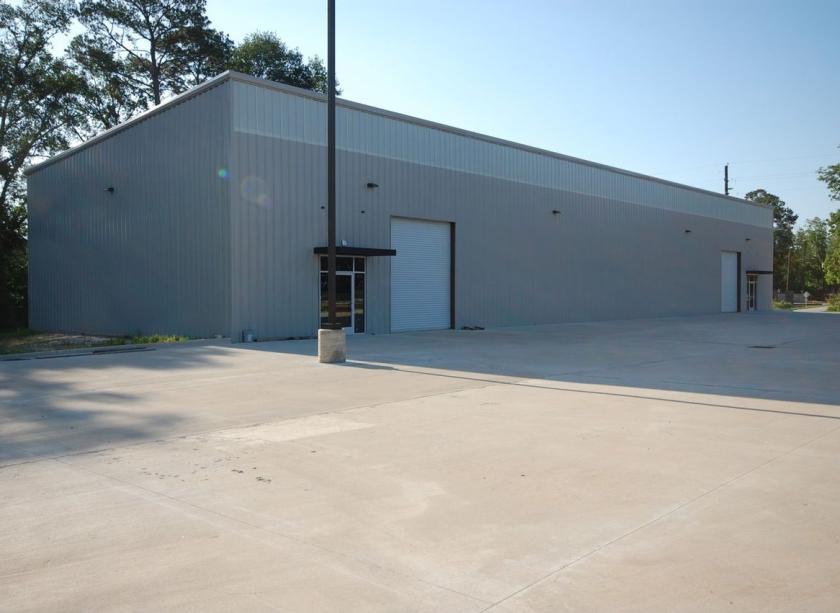
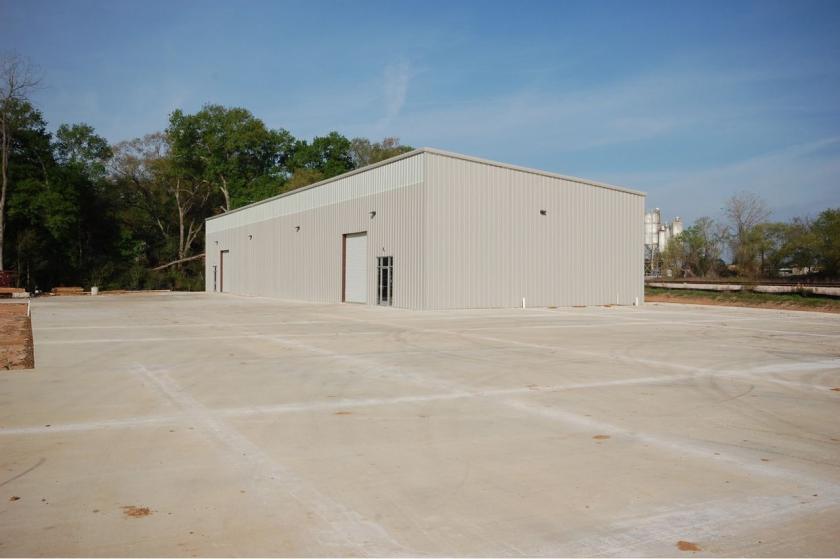
- • Building A (8,000sqft)
- • Building C (21,000sqft)
- • Building D (18,000sqft)
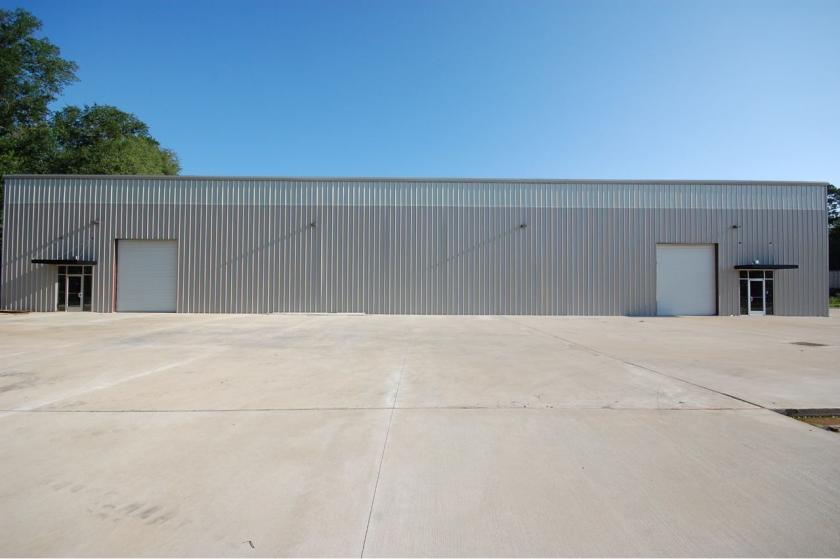
- • 22’ clear height
- • 3 phase power
- • Grade level doors
Additional Photos
Listing Agents

Beau Harris
M: 936-523-0483
beau@blacklabelcommercial.com
M: 936-523-0483
beau@blacklabelcommercial.com

Currenn Lim
M: 281-948-9653
currenn@blacklabelcommercial.com
M: 281-948-9653
currenn@blacklabelcommercial.com
While we strive to provide the most accurate information, all listing information, and demographic data, is provided by third-parties. As such, MyEListing will not be responsible for the accuracy of the information. It is strongly recommended that you verify all information with the listing agent, and any relevant agencies, prior to making any decisions.


