Commercial Land
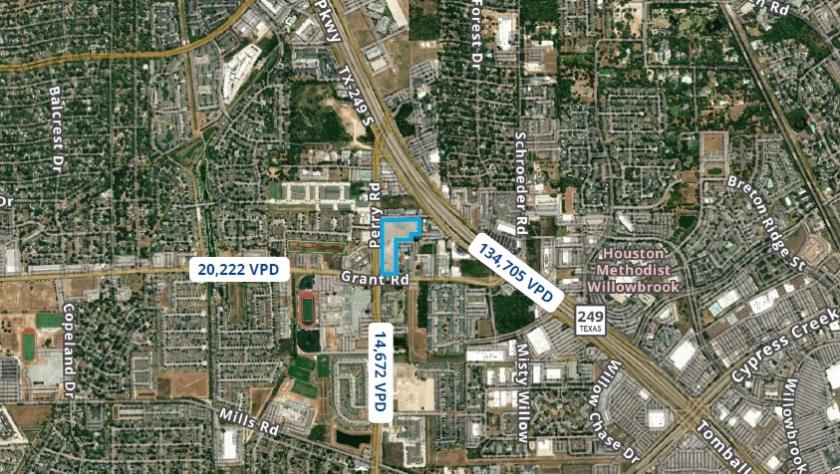
Perry Rd Grant Rd Houston, TX 77070
Perry Rd Grant Rd Houston, TX 77070
Details & Description
Property Highlights
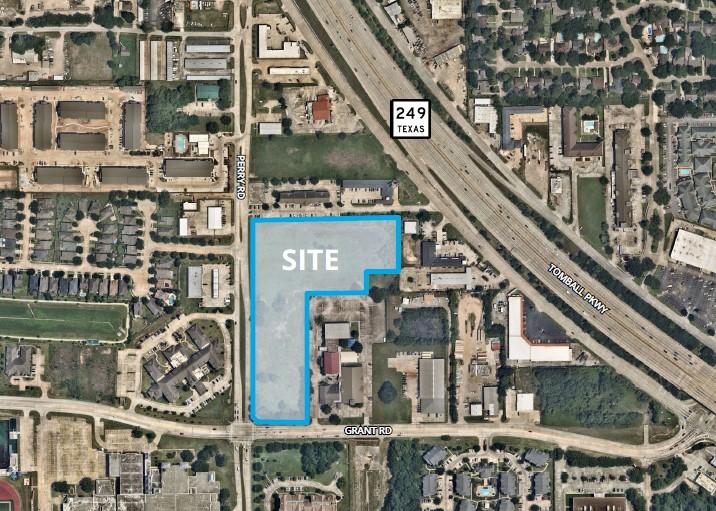
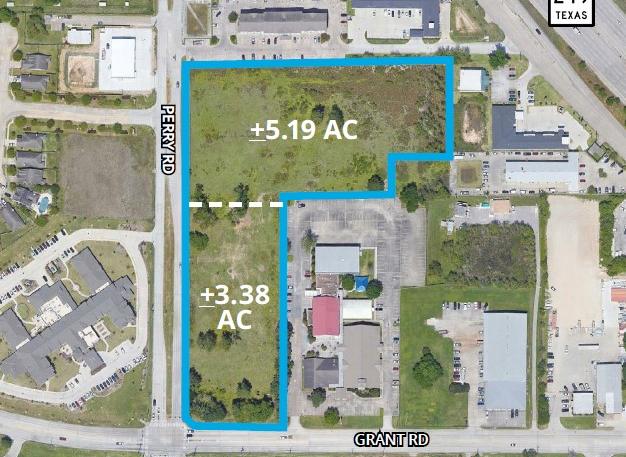
- • ± 8.57 Acres total
- • Zoning: None
- • MUD utilities potentially available
- • Detention required on-site
- • Harris County
- • No flood zone
Listing Agents

Robert Alinger
O: 713-830-2167
M: 713-724-7208
robert.alinger@colliers.com
O: 713-830-2167
M: 713-724-7208
robert.alinger@colliers.com
While we strive to provide the most accurate information, all listing information, and demographic data, is provided by third-parties. As such, MyEListing will not be responsible for the accuracy of the information. It is strongly recommended that you verify all information with the listing agent, and any relevant agencies, prior to making any decisions.