Retail Space
NEC and SEC FM 2920 and Kuykendahl Rd Spring, TX 77388
NEC and SEC FM 2920 and Kuykendahl Rd Spring, TX 77388

Details & Description
Property Highlights
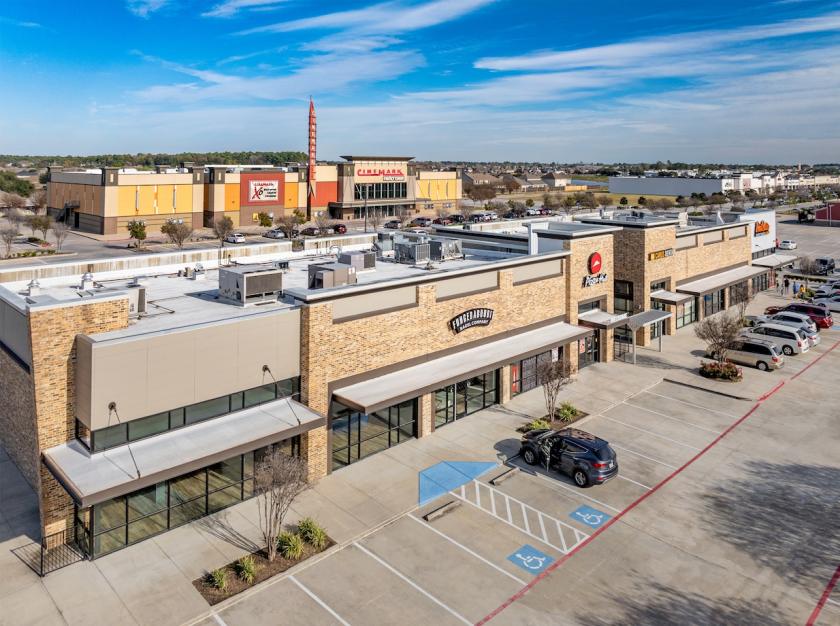
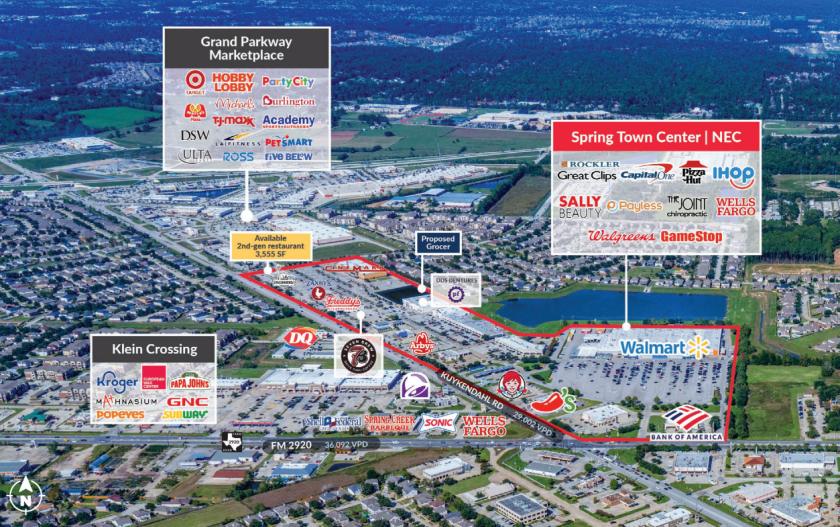
• Anchored by national tenants: Walmart, Lowe's, Cinemark, and Sprouts Market
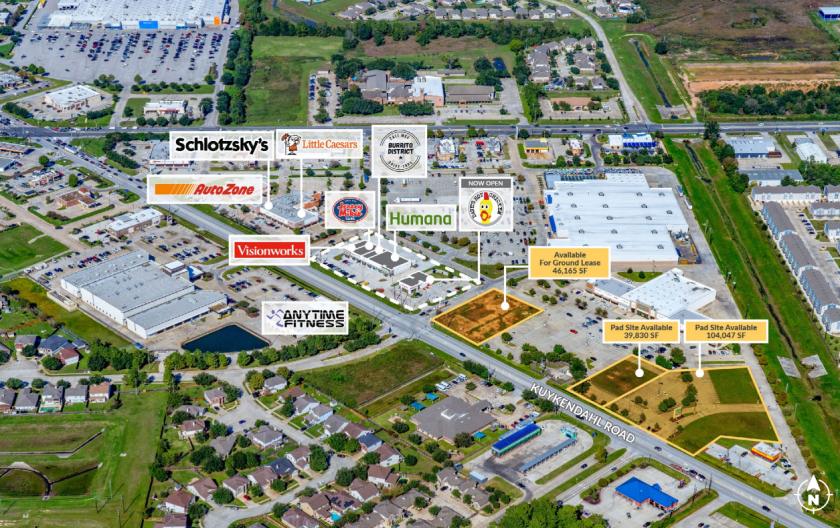
• Excellent accessibility in and out of the development from FM 2920 and Kuykendahl Rd
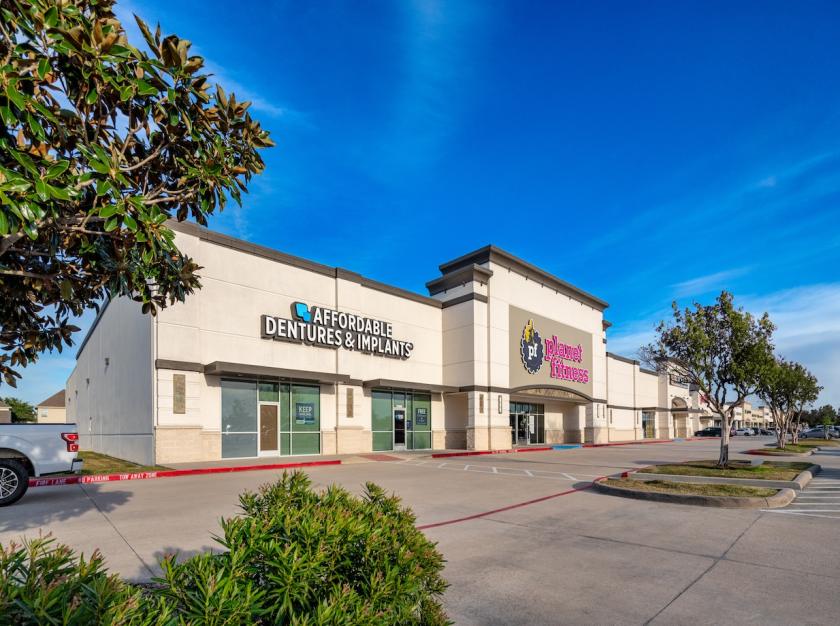
Additional Photos


Listing Agents

Kevin Sims
O: 281-477-4366
ksims@newquest.com
O: 281-477-4366
ksims@newquest.com

Lara Lee LaMendola
M: 281-640-7699
llamendola@newquest.com
M: 281-640-7699
llamendola@newquest.com
While we strive to provide the most accurate information, all listing information, and demographic data, is provided by third-parties. As such, MyEListing will not be responsible for the accuracy of the information. It is strongly recommended that you verify all information with the listing agent, and any relevant agencies, prior to making any decisions.