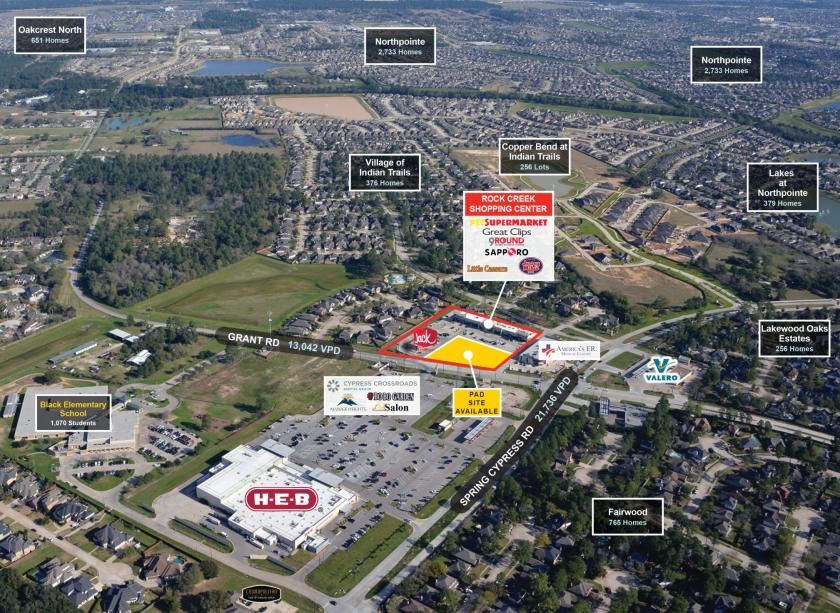
1-Mile | 3-Miles | 5-Miles | ||
---|---|---|---|---|
Total Population | 10,257 | 79,315 | 198,996 | |
Population Median Age | 37 | 37 | 37 | |
Population by Age | 0-9 Yrs | 1471 (14%) | 11540 (14%) | 28812 (14%) |
10-19 Yrs | 1762 (17%) | 12782 (16%) | 30364 (15%) | |
20-29 Yrs | 462 (4%) | 6300 (7%) | 19609 (9%) | |
30-39 Yrs | 1523 (14%) | 11560 (14%) | 30416 (15%) | |
40-49 Yrs | 1645 (16%) | 12062 (15%) | 28660 (14%) | |
50-59 Yrs | 1788 (17%) | 11437 (14%) | 26529 (13%) | |
60-69 Yrs | 954 (9%) | 7917 (9%) | 19474 (9%) | |
70+ Yrs | 652 (6%) | 5717 (7%) | 15133 (7%) | |
Median HH Income | $141,511 | $129,593 | $108,611 | |
Total Household Income | < 24K | 211 (6%) | 1612 (6%) | 4250 (6%) |
25-49K | 118 (3%) | 1836 (6%) | 7750 (11%) | |
50-74K | 350 (10%) | 3492 (13%) | 11629 (16%) | |
75-99K | 312 (9%) | 3065 (11%) | 8272 (12%) | |
100-199K | 1390 (40%) | 10178 (38%) | 24778 (36%) | |
200K+ | 1018 (29%) | 6477 (24%) | 12057 (17%) | |
Highest Education Level | No Diploma | 148 | 2005 | 8389 |
Diploma or GED | 844 | 9097 | 25442 | |
Some College | 907 | 10277 | 26563 | |
Assoc. Degree | 969 | 4385 | 11044 | |
Bachelors Degree | 2764 | 17418 | 38240 | |
Higher Degree | 1078 | 8609 | 20150 | |
Total Housing Units | 3,514 | 27,578 | 71,560 | |
--Owner-Occupied | 3,242 | 22,749 | 51,402 | |
--Renter-Occupied | 158 | 3,912 | 17,334 | |
Owner-Occupied Values | < 100K | 86 | 476 | 1317 |
100-199K | 120 | 1268 | 5886 | |
200-299K | 804 | 6872 | 19208 | |
300-399K | 941 | 7459 | 13105 | |
400-499K | 554 | 4064 | 6786 | |
500K+ | 738 | 2610 | 5101 | |
Total Working Age Population | 7,601 | 59,728 | 151,305 | |
In Work Force | 5,123 | 41,366 | 106,067 | |
Not In Work Force | 2,478 | 18,362 | 45,238 | |
Workforce Employed | 4,980 | 38,808 | 99,481 | |
Workforce Unemployed | 143 | 2,392 | 6,420 | |
Civlian Workforce | 5,123 | 41,200 | 105,901 | |
Military Workforce | 0 | 166 | 166 | |
Total Households | 3,400 | 26,661 | 68,736 | |
Family Households | 2,933 | 21,911 | 52,810 | |
Non-Family Households | 467 | 4,750 | 15,926 | |
Married Couple | 2,684 | 18,738 | 42,593 | |
Other Family | 249 | 3,173 | 10,217 | |
Married w/Child | 1,457 | 9,517 | 20,403 | |
Single Male w/Child | 0 | 626 | 1,620 | |
Single Female w/Child | 88 | 1,118 | 4,115 |
Population Change Last Two Decades - Plus Projection
2000 | % | 2010 | % | 2020 | % | 2030 | |
---|---|---|---|---|---|---|---|
Texas | 20,851,820 | +21 | 25,145,561 | +16 | 29,145,505 | +13 | 32,912,882 |
Harris County | 3,400,578 | +20 | 4,092,459 | +16 | 4,731,145 | +10 | 5,226,744 |
Total Working Age Population:
Total Households:
Total Working Age Population:
Total Households:
Total Working Age Population:
Total Households: