Industrial Properties
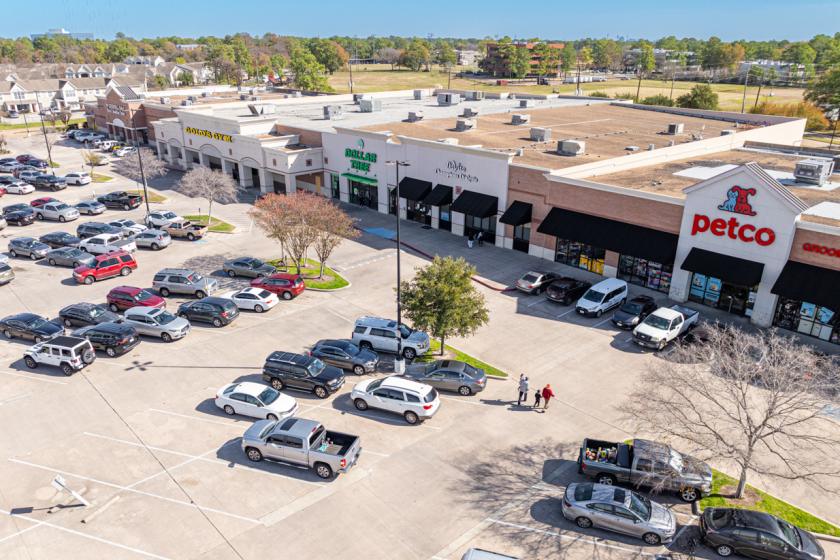
SEC FM 1960 and Veterans Memorial Dr Houston, TX 77014
SEC FM 1960 and Veterans Memorial Dr Houston, TX 77014
Details & Description
Property Highlights
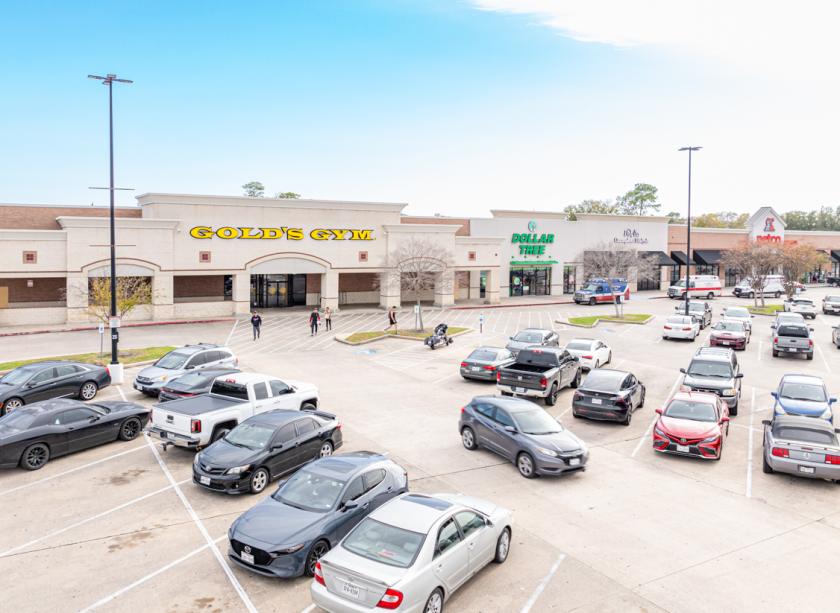
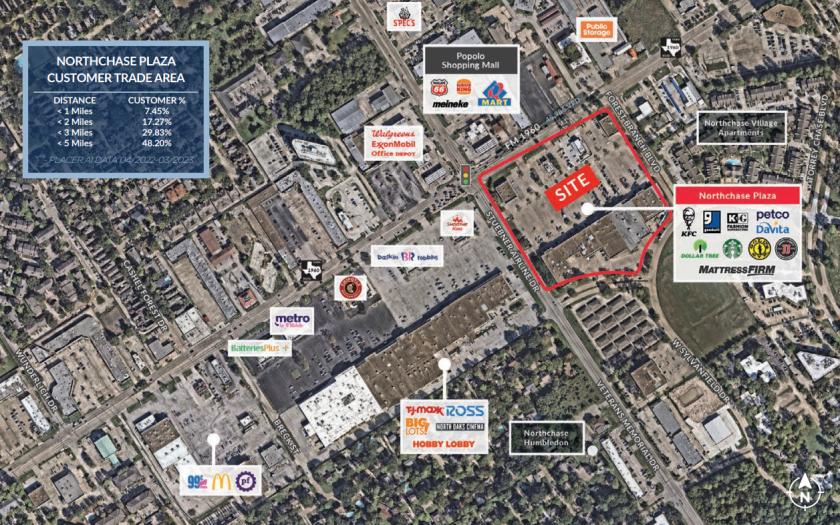
• Within the busy retail corridors of North Oaks, Champion Forest, and Willowbrook
• Within the busy retail corridors of North Oaks, Champion Forest, and Willowbrook
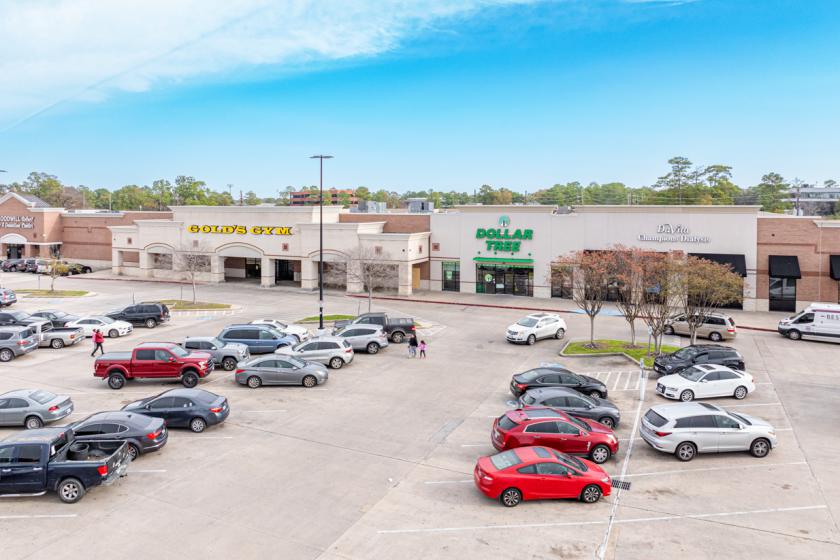
Additional Photos
Listing Agents

Kevin Sims
O: 281-477-4366
ksims@newquest.com
O: 281-477-4366
ksims@newquest.com

Nick Ramsey
O: 281-477-4359
nramsey@newquest.com
O: 281-477-4359
nramsey@newquest.com
While we strive to provide the most accurate information, all listing information, and demographic data, is provided by third-parties. As such, MyEListing will not be responsible for the accuracy of the information. It is strongly recommended that you verify all information with the listing agent, and any relevant agencies, prior to making any decisions.


