Retail Space
NWC FM 1960 Rd E and Eastway Village Dr Humble, TX 77338
NWC FM 1960 Rd E and Eastway Village Dr Humble, TX 77338
Details & Description
Property Highlights
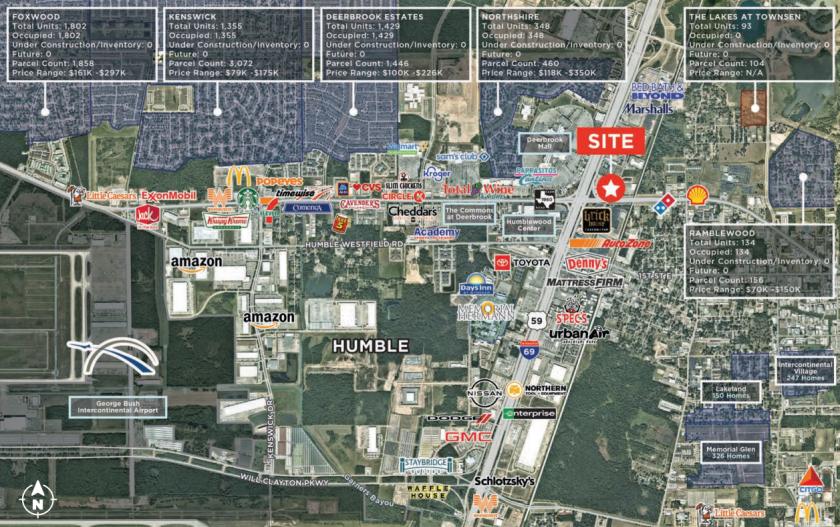
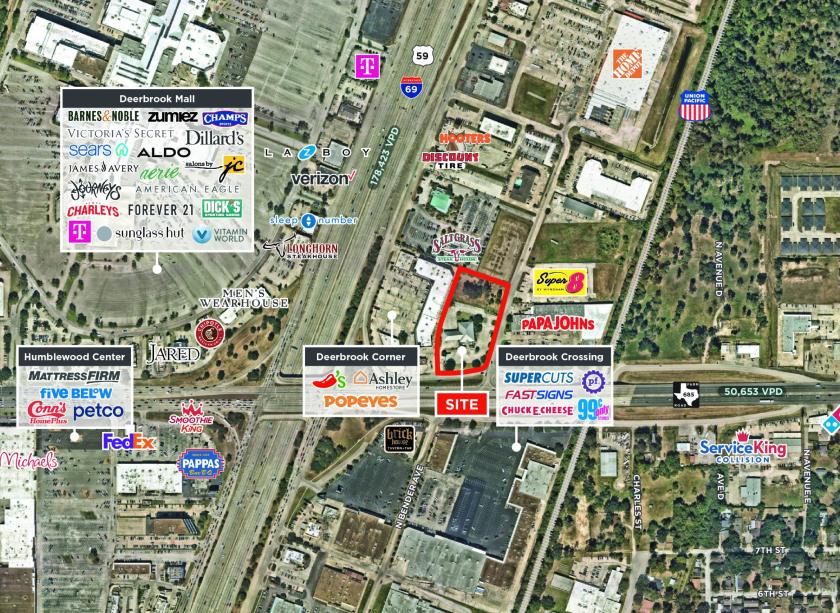
- • 2.87-AC pad site available
- • Existing building on site can be used
- • Surrounded by strong retailers and Deerbrook Mall
- • Near intersection of Hwy 59 and FM 1960
- • Ideal for bank, restaurant, medical or retail
Listing Agents

Kevin Sims
O: 281-477-4366
ksims@newquest.com
O: 281-477-4366
ksims@newquest.com

Nick Ramsey
O: 281-477-4359
nramsey@newquest.com
O: 281-477-4359
nramsey@newquest.com
While we strive to provide the most accurate information, all listing information, and demographic data, is provided by third-parties. As such, MyEListing will not be responsible for the accuracy of the information. It is strongly recommended that you verify all information with the listing agent, and any relevant agencies, prior to making any decisions.