Retail Space
SEC Pasadena Blvd and Southmore Ave Pasadena, TX 77502
SEC Pasadena Blvd and Southmore Ave Pasadena, TX 77502

Details & Description
Property Highlights
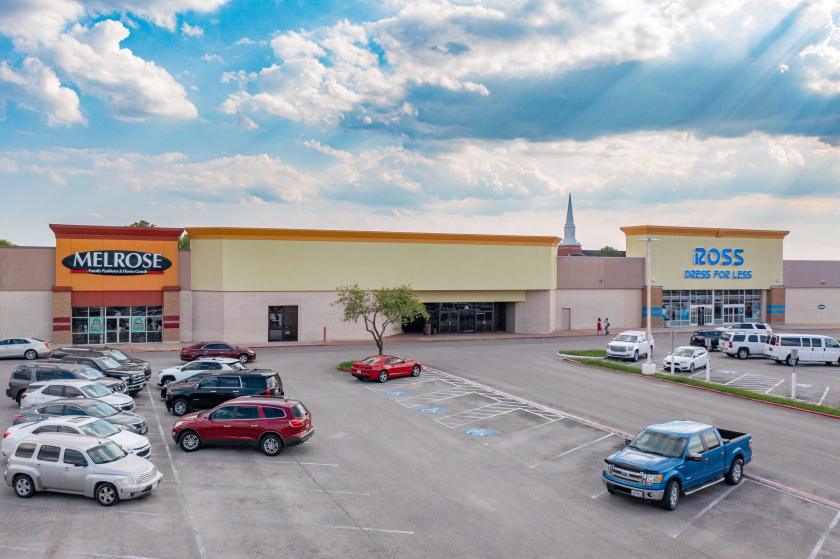
• Located in one of the fastest-growing areas in the country, at the main intersection for the trade area
• Anchored by Ross, DD's, Dollar Tree
Additional Photos


Listing Agents

Bob Conwell
O: 281-477-4324
bconwell@newquest.com
O: 281-477-4324
bconwell@newquest.com
While we strive to provide the most accurate information, all listing information, and demographic data, is provided by third-parties. As such, MyEListing will not be responsible for the accuracy of the information. It is strongly recommended that you verify all information with the listing agent, and any relevant agencies, prior to making any decisions.


