Retail Space
NEC Highway 290 and Mason Rd Cypress, TX 77433
NEC Highway 290 and Mason Rd Cypress, TX 77433

Details & Description
Property Highlights
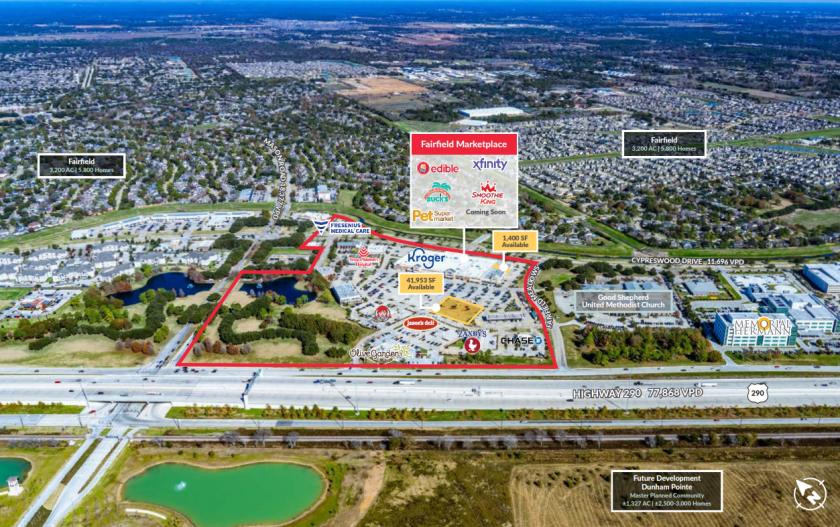
• Less than 2 miles from the Grand Parkway / SH-99 and Mason Road bringing more than 110K VPD
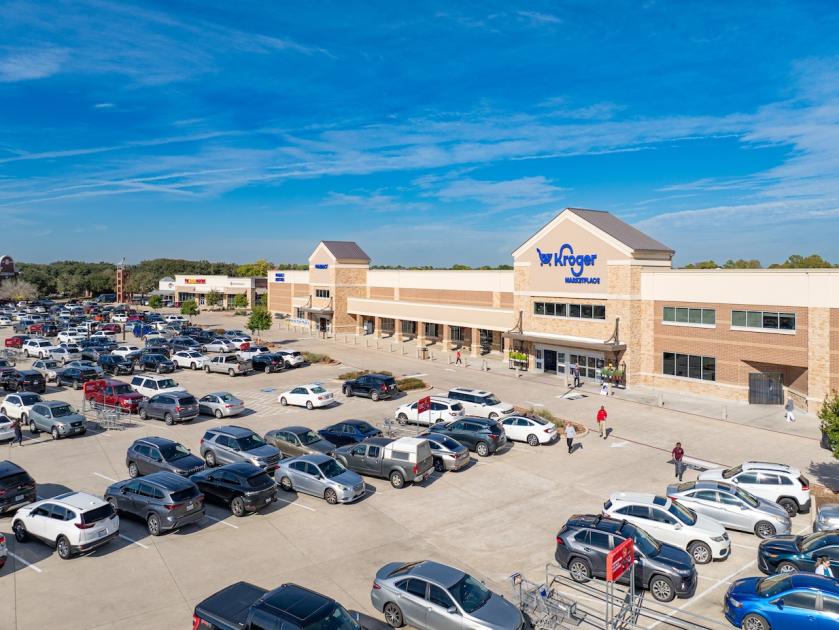
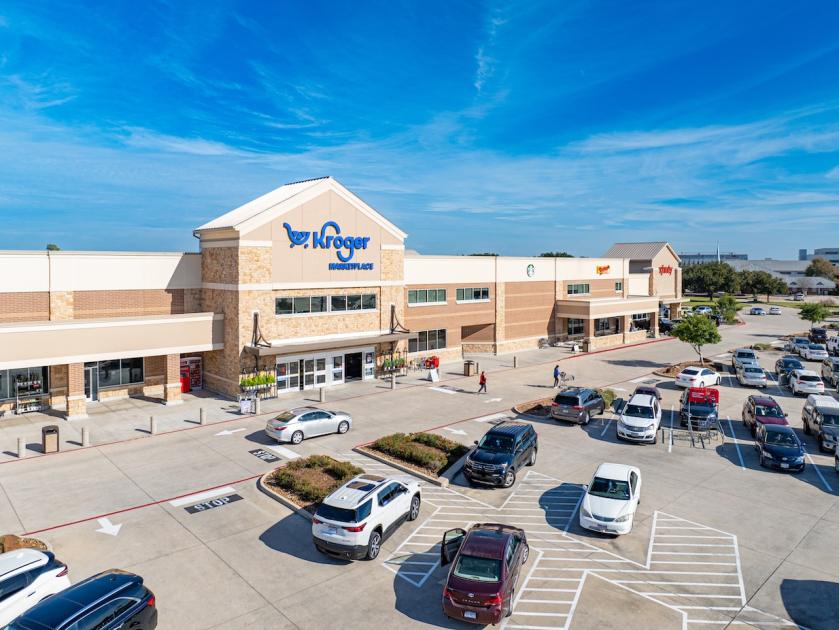
• Anchored by a 123,000-SF Kroger Marketplace which averages 70,000+ visits per month
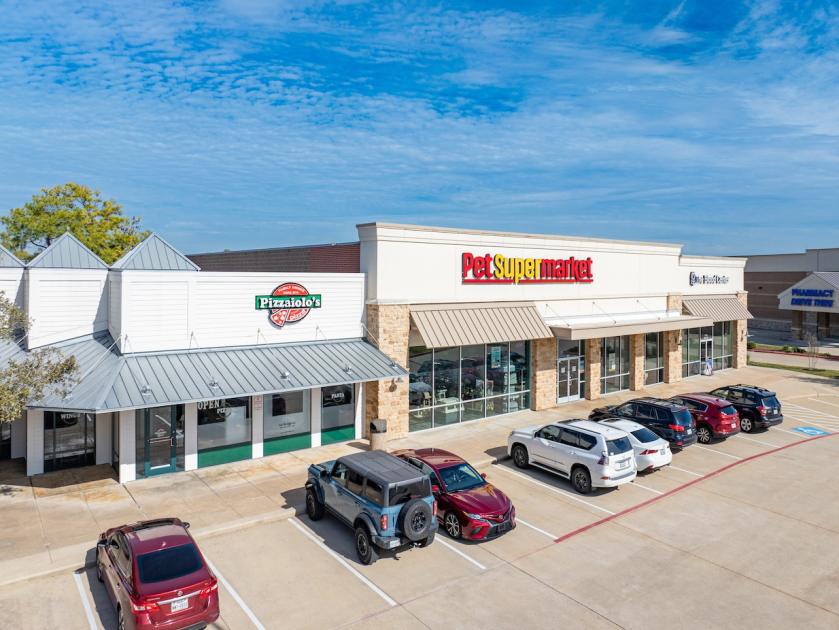
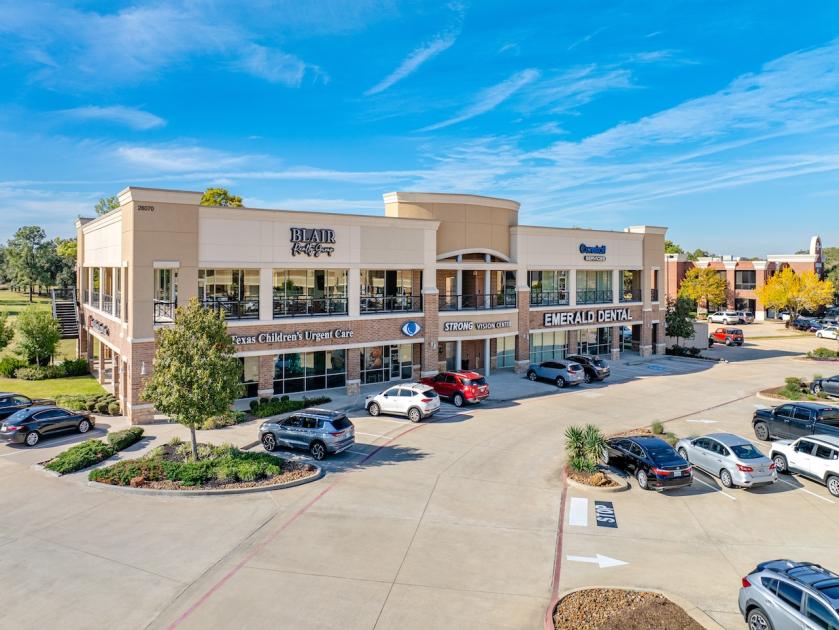
Additional Photos

Listing Agents

Bob Conwell
O: 281-477-4324
bconwell@newquest.com
O: 281-477-4324
bconwell@newquest.com
While we strive to provide the most accurate information, all listing information, and demographic data, is provided by third-parties. As such, MyEListing will not be responsible for the accuracy of the information. It is strongly recommended that you verify all information with the listing agent, and any relevant agencies, prior to making any decisions.