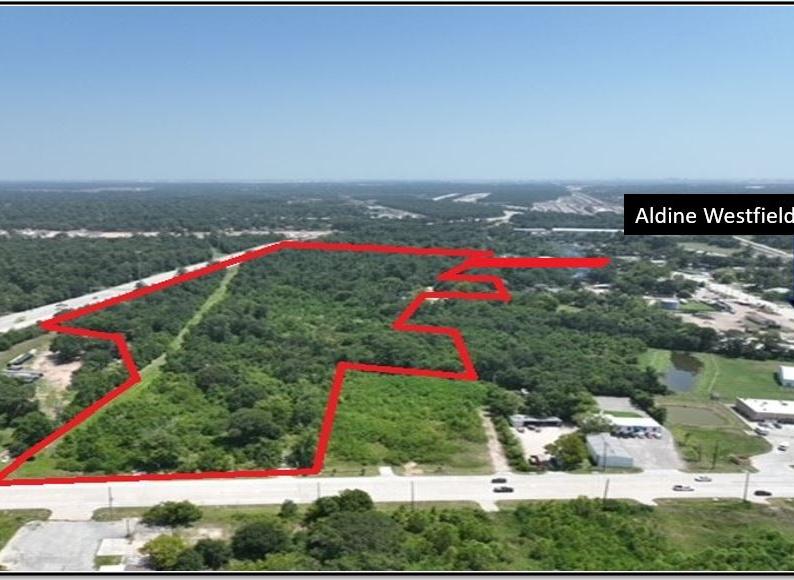
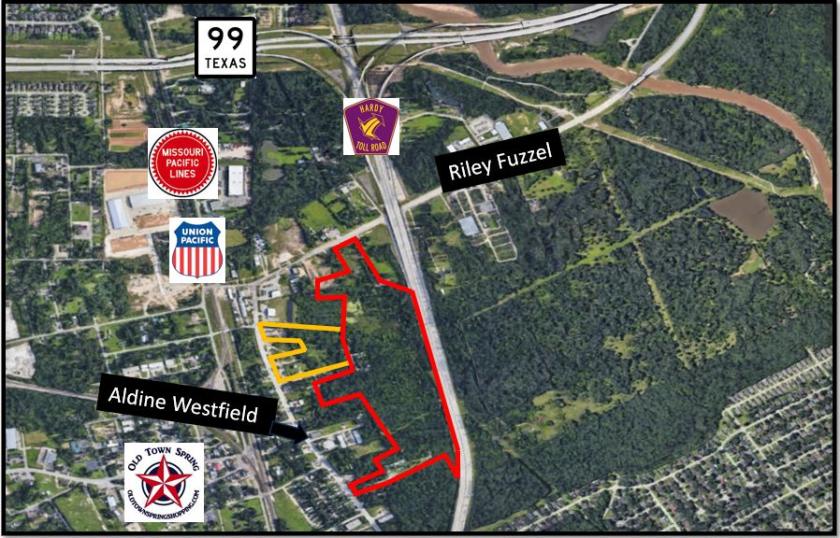
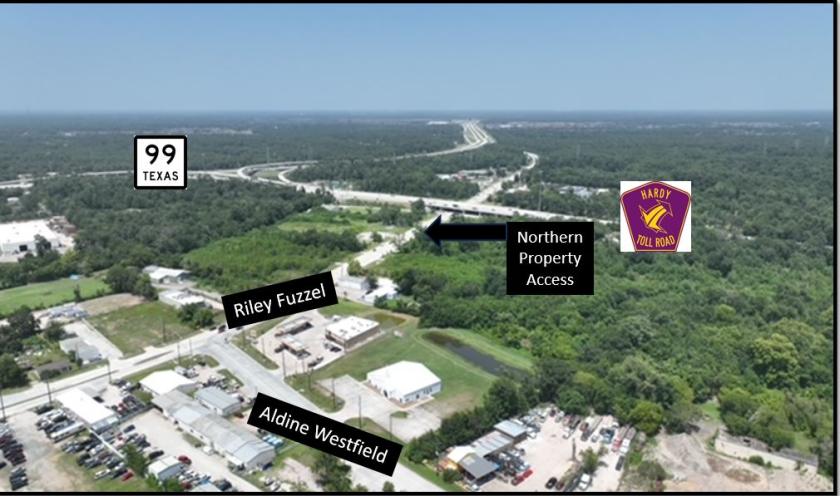
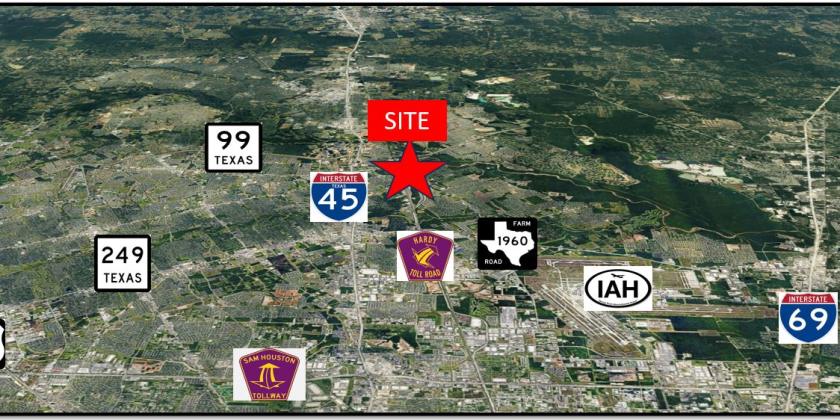
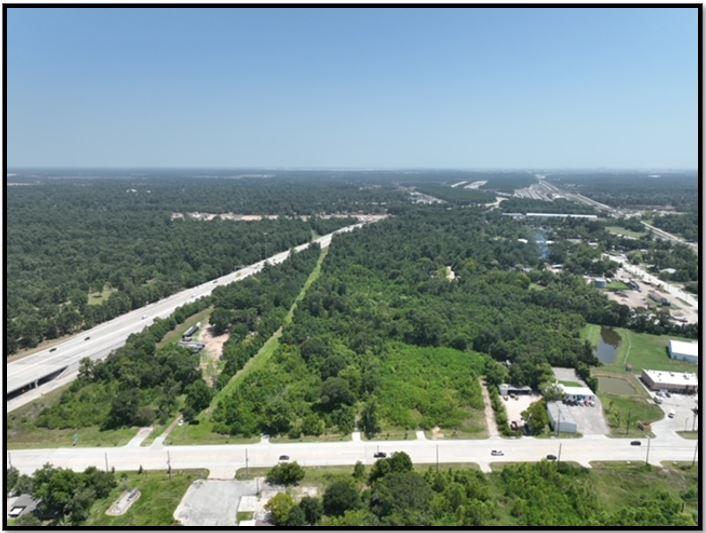
1-Mile | 3-Miles | 5-Miles | ||
---|---|---|---|---|
Total Population | 5,958 | 77,006 | 215,624 | |
Population Median Age | 35 | 34 | 34 | |
Population by Age | 0-9 Yrs | 851 (14%) | 12340 (16%) | 32537 (15%) |
10-19 Yrs | 600 (10%) | 10746 (13%) | 31973 (14%) | |
20-29 Yrs | 1028 (17%) | 10998 (14%) | 32613 (15%) | |
30-39 Yrs | 1127 (18%) | 13593 (17%) | 35212 (16%) | |
40-49 Yrs | 914 (15%) | 11805 (15%) | 29839 (13%) | |
50-59 Yrs | 563 (9%) | 7084 (9%) | 23813 (11%) | |
60-69 Yrs | 490 (8%) | 6436 (8%) | 18135 (8%) | |
70+ Yrs | 385 (6%) | 4005 (5%) | 11502 (5%) | |
Median HH Income | $99,029 | $99,950 | $88,575 | |
Total Household Income | < 24K | 194 (8%) | 1621 (6%) | 8086 (10%) |
25-49K | 214 (9%) | 2764 (10%) | 11150 (14%) | |
50-74K | 433 (19%) | 4800 (18%) | 13041 (17%) | |
75-99K | 293 (13%) | 3841 (14%) | 10652 (13%) | |
100-199K | 898 (40%) | 9462 (36%) | 24510 (32%) | |
200K+ | 213 (9%) | 3549 (13%) | 8685 (11%) | |
Highest Education Level | No Diploma | 154 | 3540 | 11553 |
Diploma or GED | 1159 | 10958 | 31665 | |
Some College | 1031 | 11391 | 32413 | |
Assoc. Degree | 408 | 4927 | 13058 | |
Bachelors Degree | 1156 | 12472 | 33640 | |
Higher Degree | 412 | 6336 | 15571 | |
Total Housing Units | 2,360 | 27,423 | 81,467 | |
--Owner-Occupied | 1,555 | 18,666 | 47,437 | |
--Renter-Occupied | 689 | 7,370 | 28,686 | |
Owner-Occupied Values | < 100K | 20 | 219 | 1298 |
100-199K | 538 | 5789 | 13365 | |
200-299K | 679 | 8168 | 19610 | |
300-399K | 188 | 2446 | 6654 | |
400-499K | 102 | 1548 | 3593 | |
500K+ | 29 | 497 | 2917 | |
Total Working Age Population | 4,789 | 58,396 | 163,338 | |
In Work Force | 3,661 | 42,228 | 116,814 | |
Not In Work Force | 1,128 | 16,168 | 46,524 | |
Workforce Employed | 3,493 | 40,048 | 111,071 | |
Workforce Unemployed | 101 | 1,805 | 5,168 | |
Civlian Workforce | 3,594 | 41,853 | 116,239 | |
Military Workforce | 68 | 374 | 575 | |
Total Households | 2,244 | 26,036 | 76,123 | |
Family Households | 1,603 | 19,692 | 53,444 | |
Non-Family Households | 641 | 6,344 | 22,679 | |
Married Couple | 1,225 | 15,546 | 39,909 | |
Other Family | 378 | 4,146 | 13,535 | |
Married w/Child | 585 | 8,149 | 20,533 | |
Single Male w/Child | 9 | 752 | 1,937 | |
Single Female w/Child | 40 | 1,156 | 4,950 |
Population Change Last Two Decades - Plus Projection
2000 | % | 2010 | % | 2020 | % | 2030 | |
---|---|---|---|---|---|---|---|
Texas | 20,851,820 | +21 | 25,145,561 | +16 | 29,145,505 | +13 | 32,912,882 |
Harris County | 3,400,578 | +20 | 4,092,459 | +16 | 4,731,145 | +10 | 5,226,744 |
Montgomery County | 293,768 | +55 | 455,746 | +36 | 620,443 | +27 | 785,953 |
Total Working Age Population:
Total Households:
Total Working Age Population:
Total Households:
Total Working Age Population:
Total Households: