Industrial Properties
1520 Farm to Market 1960 Houston, TX 77090
1520 Farm to Market 1960 Houston, TX 77090
Details & Description
Property Highlights
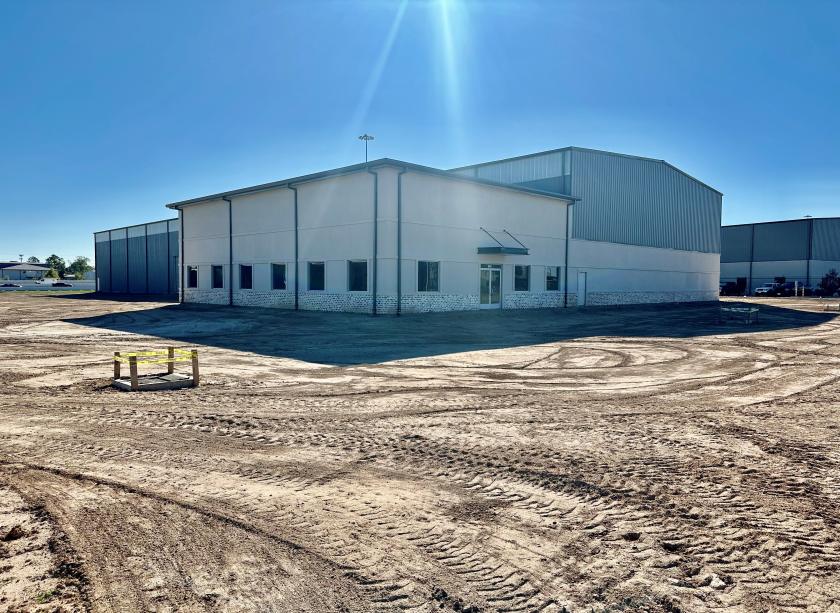
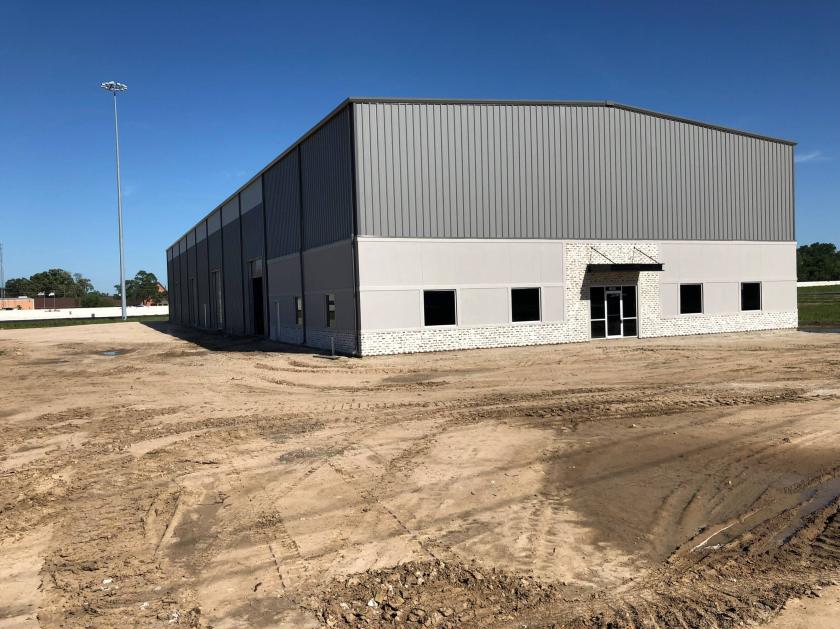
- • 25,000sqft Industrial Space/2.326 Acres
- • 32’ Eave height
- • 20 Ton Crane Ready
- • 3 phase, 480v power/1200 amp
- • 2.326 acre site / outside storage area
- • Space for loading dock/future truck well
Additional Photos


Listing Agents

Beau Harris
M: 936-523-0483
beau@blacklabelcommercial.com
M: 936-523-0483
beau@blacklabelcommercial.com

Stratton Butaud
O: 936-441-2610
M: 936-232-9357
stratton@blacklabelcommercial.com
O: 936-441-2610
M: 936-232-9357
stratton@blacklabelcommercial.com
While we strive to provide the most accurate information, all listing information, and demographic data, is provided by third-parties. As such, MyEListing will not be responsible for the accuracy of the information. It is strongly recommended that you verify all information with the listing agent, and any relevant agencies, prior to making any decisions.


