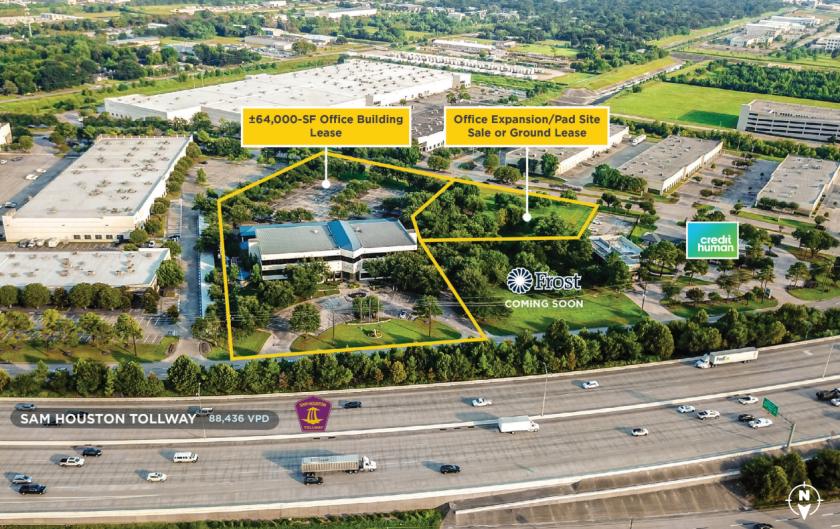
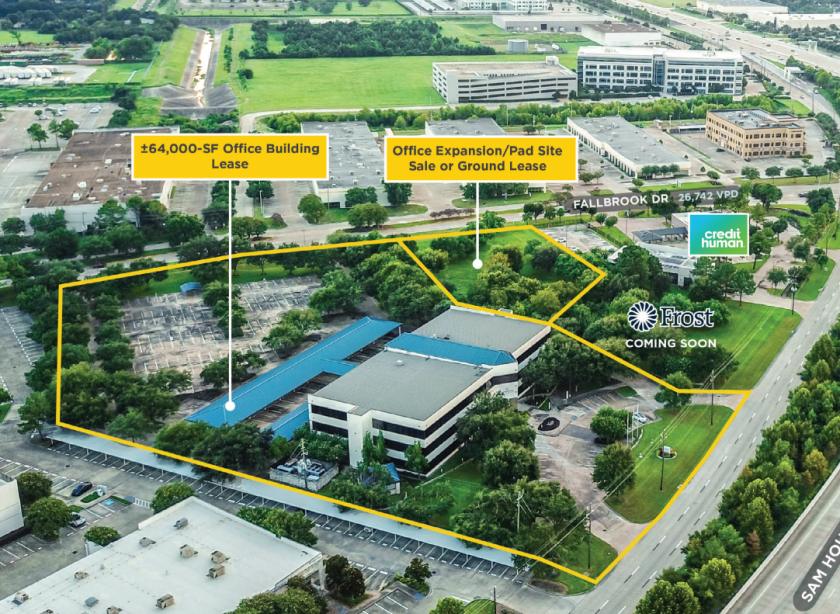
1-Mile | 3-Miles | 5-Miles | ||
---|---|---|---|---|
Total Population | 12,251 | 109,324 | 284,728 | |
Population Median Age | 33 | 35 | 36 | |
Population by Age | 0-9 Yrs | 2158 (17%) | 14373 (13%) | 37260 (13%) |
10-19 Yrs | 1790 (14%) | 17321 (15%) | 44189 (15%) | |
20-29 Yrs | 2004 (16%) | 16756 (15%) | 41283 (14%) | |
30-39 Yrs | 1889 (15%) | 16092 (14%) | 40973 (14%) | |
40-49 Yrs | 1376 (11%) | 13973 (12%) | 36712 (12%) | |
50-59 Yrs | 1242 (10%) | 13465 (12%) | 35859 (12%) | |
60-69 Yrs | 1157 (9%) | 10707 (9%) | 27793 (9%) | |
70+ Yrs | 635 (5%) | 6637 (6%) | 20660 (7%) | |
Median HH Income | $84,192 | $77,150 | $72,777 | |
Total Household Income | < 24K | 348 (9%) | 4451 (11%) | 12464 (12%) |
25-49K | 711 (18%) | 7737 (20%) | 20665 (20%) | |
50-74K | 543 (14%) | 6307 (16%) | 18233 (18%) | |
75-99K | 809 (21%) | 5730 (15%) | 15083 (15%) | |
100-199K | 1072 (28%) | 10242 (26%) | 24861 (24%) | |
200K+ | 316 (8%) | 3508 (9%) | 8481 (8%) | |
Highest Education Level | No Diploma | 1181 | 10442 | 30628 |
Diploma or GED | 2065 | 17065 | 44981 | |
Some College | 1536 | 15966 | 40312 | |
Assoc. Degree | 653 | 6228 | 14883 | |
Bachelors Degree | 1779 | 14441 | 37246 | |
Higher Degree | 388 | 5332 | 15048 | |
Total Housing Units | 4,001 | 40,650 | 106,960 | |
--Owner-Occupied | 2,474 | 20,202 | 55,773 | |
--Renter-Occupied | 1,325 | 17,774 | 44,015 | |
Owner-Occupied Values | < 100K | 202 | 1145 | 3502 |
100-199K | 819 | 6325 | 18624 | |
200-299K | 1290 | 8392 | 21958 | |
300-399K | 140 | 2898 | 7281 | |
400-499K | 15 | 961 | 2309 | |
500K+ | 8 | 480 | 2099 | |
Total Working Age Population | 8,877 | 84,127 | 219,866 | |
In Work Force | 6,471 | 60,458 | 152,906 | |
Not In Work Force | 2,407 | 23,669 | 66,961 | |
Workforce Employed | 5,997 | 56,286 | 141,562 | |
Workforce Unemployed | 474 | 4,172 | 11,294 | |
Civlian Workforce | 6,471 | 60,458 | 152,856 | |
Military Workforce | 0 | 1 | 50 | |
Total Households | 3,799 | 37,975 | 99,788 | |
Family Households | 2,969 | 26,721 | 69,697 | |
Non-Family Households | 830 | 11,254 | 30,091 | |
Married Couple | 2,158 | 18,020 | 46,814 | |
Other Family | 811 | 8,701 | 22,883 | |
Married w/Child | 918 | 7,343 | 19,842 | |
Single Male w/Child | 64 | 975 | 2,738 | |
Single Female w/Child | 316 | 3,931 | 9,974 |
Population Change Last Two Decades - Plus Projection
2000 | % | 2010 | % | 2020 | % | 2030 | |
---|---|---|---|---|---|---|---|
Texas | 20,851,820 | +21 | 25,145,561 | +16 | 29,145,505 | +13 | 32,912,882 |
Harris County | 3,400,578 | +20 | 4,092,459 | +16 | 4,731,145 | +10 | 5,226,744 |
Total Working Age Population:
Total Households:
Total Working Age Population:
Total Households:
Total Working Age Population:
Total Households: