Retail Space
6425 San Felipe Street Houston, TX 77057
6425 San Felipe Street Houston, TX 77057
Details & Description
Property Highlights
• Nearby grocers include Kroger, Whole Foods and Trader Joe’s
• Easy access and great visibility from San Felipe Street
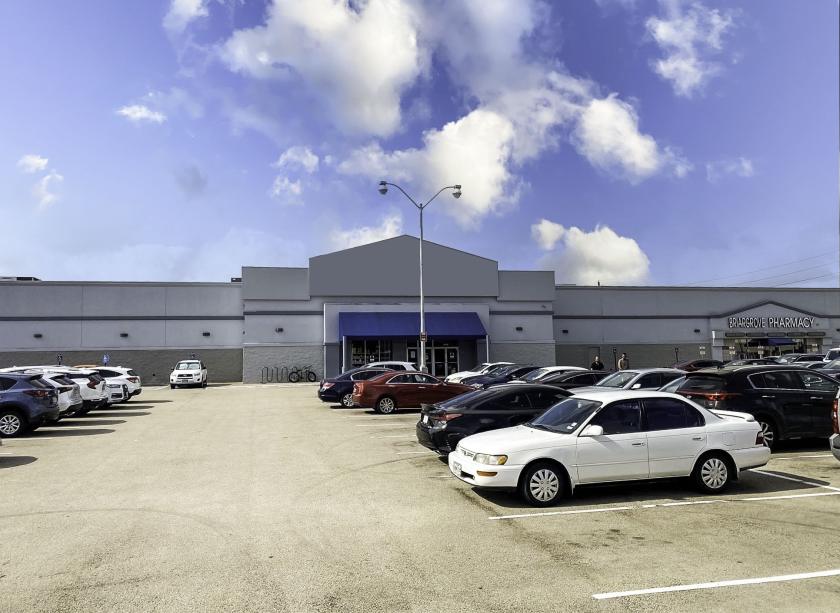
Additional Photos


Listing Agents

Bob Conwell
O: 281-477-4324
bconwell@newquest.com
O: 281-477-4324
bconwell@newquest.com

Josh Friedlander
O: 281-477-4381
jfriedlander@newquest.com
O: 281-477-4381
jfriedlander@newquest.com
While we strive to provide the most accurate information, all listing information, and demographic data, is provided by third-parties. As such, MyEListing will not be responsible for the accuracy of the information. It is strongly recommended that you verify all information with the listing agent, and any relevant agencies, prior to making any decisions.


