Commercial Land
NWQ E Sam Houston Pkwy N and Wallisville Rd Houston, TX 77049
NWQ E Sam Houston Pkwy N and Wallisville Rd Houston, TX 77049

Details & Description
Property Highlights
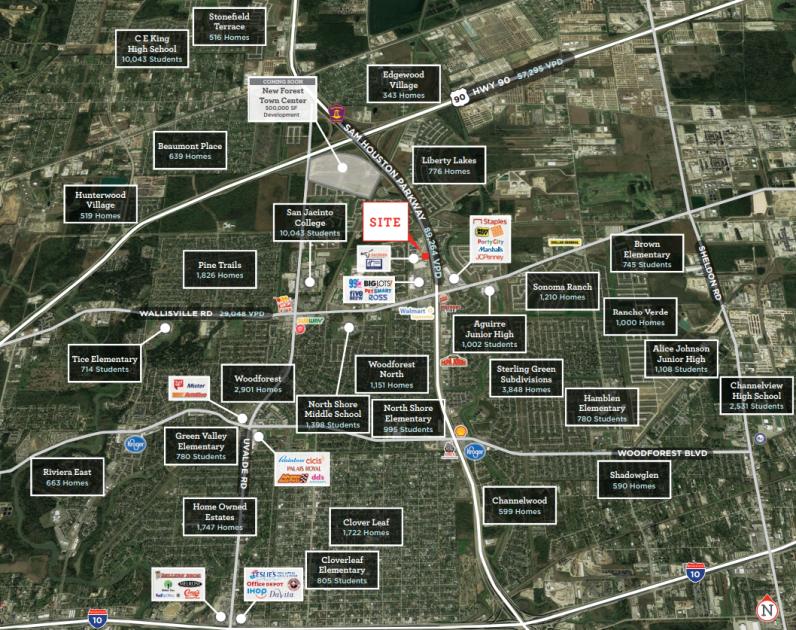
• Approx. one mile from North Campus of San Jacinto College which spans 105 acres and serves 5,160 students and staff
• Cross access with 310,000 SF New Forest Shopping Center anchored by Lowes, Ross and PetSmart
Listing Agents

Andrew Alvis
O: 281-477-5038
andrew.alvis@newquest.com
O: 281-477-5038
andrew.alvis@newquest.com
While we strive to provide the most accurate information, all listing information, and demographic data, is provided by third-parties. As such, MyEListing will not be responsible for the accuracy of the information. It is strongly recommended that you verify all information with the listing agent, and any relevant agencies, prior to making any decisions.