Commercial Land
NEQ Tomball Pkwy and Medical Complex Dr Tomball, TX 77377
NEQ Tomball Pkwy and Medical Complex Dr Tomball, TX 77377

Details & Description
Property Highlights
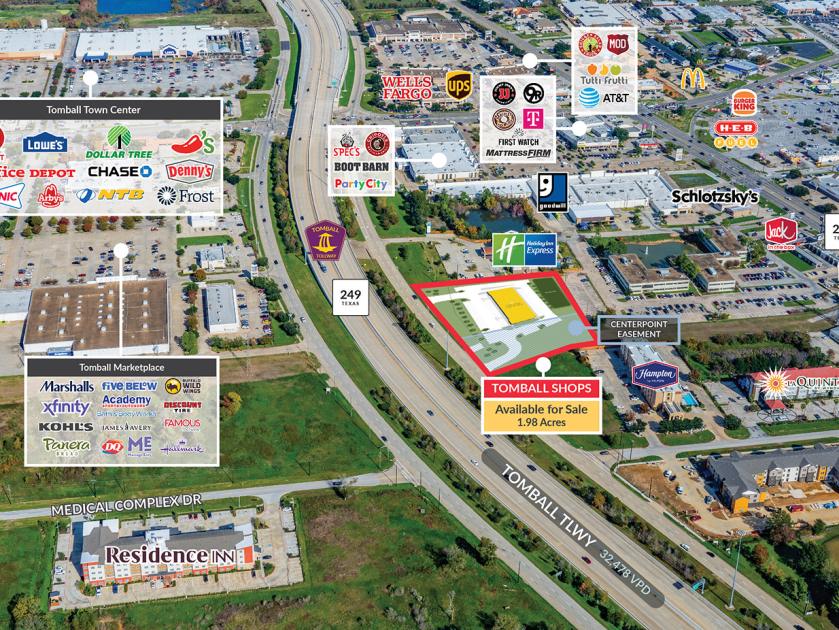
• Frontage: Approx. 285’ on SH 249
• Frontage: Approx. 285’ on SH 249
Listing Agents

Andrew Alvis
O: 281-477-5038
andrew.alvis@newquest.com
O: 281-477-5038
andrew.alvis@newquest.com
While we strive to provide the most accurate information, all listing information, and demographic data, is provided by third-parties. As such, MyEListing will not be responsible for the accuracy of the information. It is strongly recommended that you verify all information with the listing agent, and any relevant agencies, prior to making any decisions.