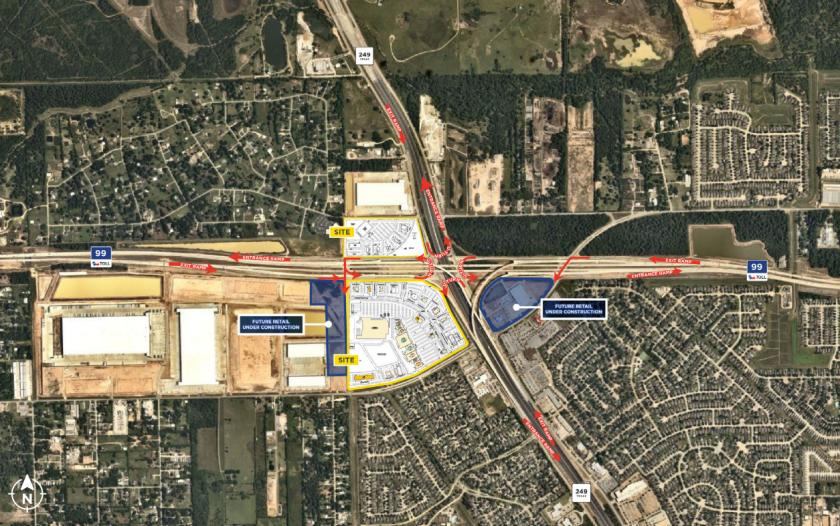
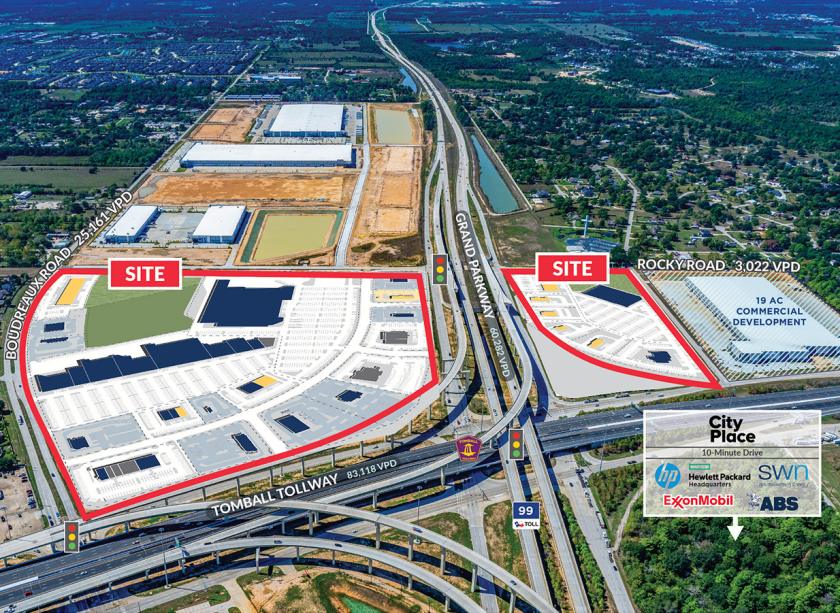
1-Mile | 3-Miles | 5-Miles | ||
---|---|---|---|---|
Total Population | 7,583 | 63,620 | 162,169 | |
Population Median Age | 38 | 35 | 36 | |
Population by Age | 0-9 Yrs | 933 (12%) | 10906 (17%) | 25255 (15%) |
10-19 Yrs | 1156 (15%) | 10295 (16%) | 24763 (15%) | |
20-29 Yrs | 816 (10%) | 5456 (8%) | 16148 (9%) | |
30-39 Yrs | 1032 (13%) | 10664 (16%) | 24288 (14%) | |
40-49 Yrs | 876 (11%) | 9169 (14%) | 22769 (14%) | |
50-59 Yrs | 1316 (17%) | 6913 (10%) | 19852 (12%) | |
60-69 Yrs | 968 (12%) | 5329 (8%) | 16001 (9%) | |
70+ Yrs | 485 (6%) | 4888 (7%) | 13094 (8%) | |
Median HH Income | $102,343 | $109,709 | $111,596 | |
Total Household Income | < 24K | 221 (8%) | 1761 (8%) | 4448 (8%) |
25-49K | 254 (9%) | 2023 (9%) | 5257 (9%) | |
50-74K | 356 (13%) | 3638 (17%) | 8133 (14%) | |
75-99K | 445 (16%) | 2101 (10%) | 6732 (12%) | |
100-199K | 1078 (40%) | 7778 (37%) | 19456 (35%) | |
200K+ | 297 (11%) | 3688 (17%) | 10565 (19%) | |
Highest Education Level | No Diploma | 280 | 2148 | 5759 |
Diploma or GED | 1093 | 8545 | 19760 | |
Some College | 1025 | 7908 | 21772 | |
Assoc. Degree | 421 | 3190 | 9378 | |
Bachelors Degree | 1265 | 11370 | 31388 | |
Higher Degree | 970 | 6633 | 16384 | |
Total Housing Units | 2,656 | 21,603 | 56,375 | |
--Owner-Occupied | 2,192 | 16,256 | 42,749 | |
--Renter-Occupied | 459 | 4,732 | 11,843 | |
Owner-Occupied Values | < 100K | 162 | 575 | 1824 |
100-199K | 269 | 1635 | 4071 | |
200-299K | 1060 | 5792 | 14773 | |
300-399K | 487 | 3798 | 10372 | |
400-499K | 132 | 2592 | 6386 | |
500K+ | 81 | 1863 | 5323 | |
Total Working Age Population | 5,893 | 46,380 | 121,529 | |
In Work Force | 4,079 | 31,936 | 82,677 | |
Not In Work Force | 1,813 | 14,444 | 38,852 | |
Workforce Employed | 3,914 | 30,259 | 78,320 | |
Workforce Unemployed | 165 | 1,655 | 4,249 | |
Civlian Workforce | 4,079 | 31,914 | 82,568 | |
Military Workforce | 0 | 22 | 109 | |
Total Households | 2,651 | 20,988 | 54,592 | |
Family Households | 2,138 | 16,322 | 42,337 | |
Non-Family Households | 513 | 4,667 | 12,255 | |
Married Couple | 1,584 | 13,180 | 35,171 | |
Other Family | 554 | 3,142 | 7,166 | |
Married w/Child | 637 | 7,504 | 17,828 | |
Single Male w/Child | 185 | 456 | 881 | |
Single Female w/Child | 220 | 1,577 | 3,381 |
Population Change Last Two Decades - Plus Projection
2000 | % | 2010 | % | 2020 | % | 2030 | |
---|---|---|---|---|---|---|---|
Texas | 20,851,820 | +21 | 25,145,561 | +16 | 29,145,505 | +13 | 32,912,882 |
Harris County | 3,400,578 | +20 | 4,092,459 | +16 | 4,731,145 | +10 | 5,226,744 |
Montgomery County | 293,768 | +55 | 455,746 | +36 | 620,443 | +27 | 785,953 |
Total Working Age Population:
Total Households:
Total Working Age Population:
Total Households:
Total Working Age Population:
Total Households: