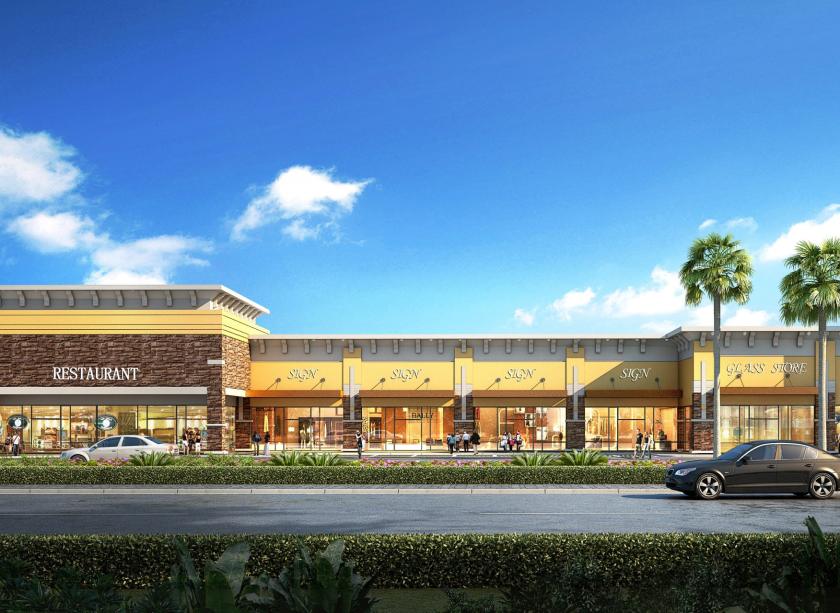
Retail Space
8205 West Sam Houston Parkway South Houston, TX 77072
8205 West Sam Houston Parkway South Houston, TX 77072
Details & Description
Property Highlights
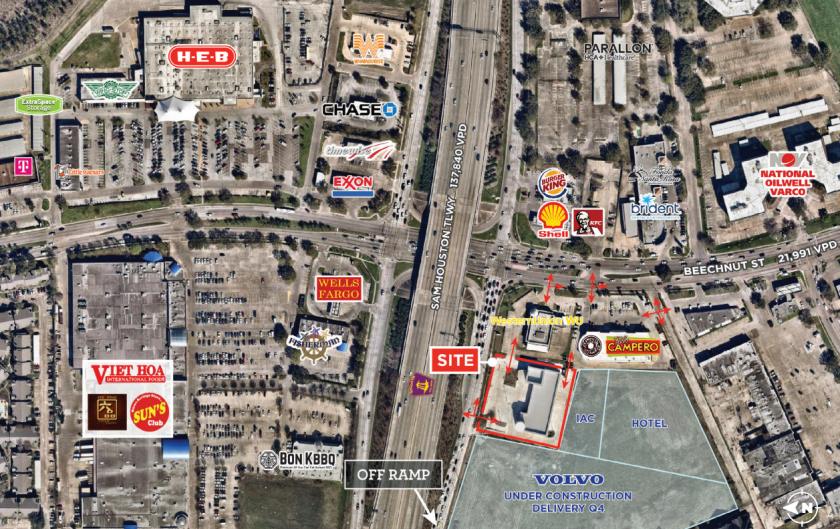
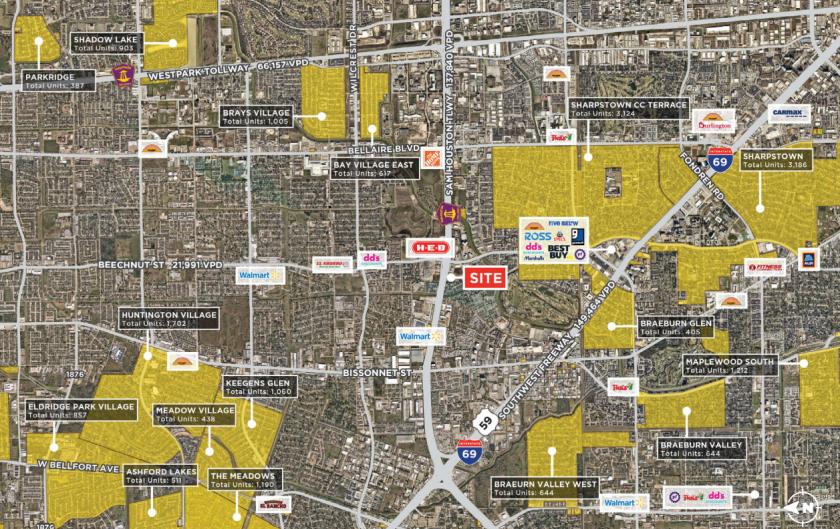
- • Huge traffic counts
- • Great visibility and exposure
- • Multiple access points from feeder road
- • Ample parking
Listing Agents

Andrew Alvis
O: 281-477-5038
andrew.alvis@newquest.com
O: 281-477-5038
andrew.alvis@newquest.com

Austin Baldridge
O: 281-477-4363
abaldridge@newquest.com
O: 281-477-4363
abaldridge@newquest.com
While we strive to provide the most accurate information, all listing information, and demographic data, is provided by third-parties. As such, MyEListing will not be responsible for the accuracy of the information. It is strongly recommended that you verify all information with the listing agent, and any relevant agencies, prior to making any decisions.