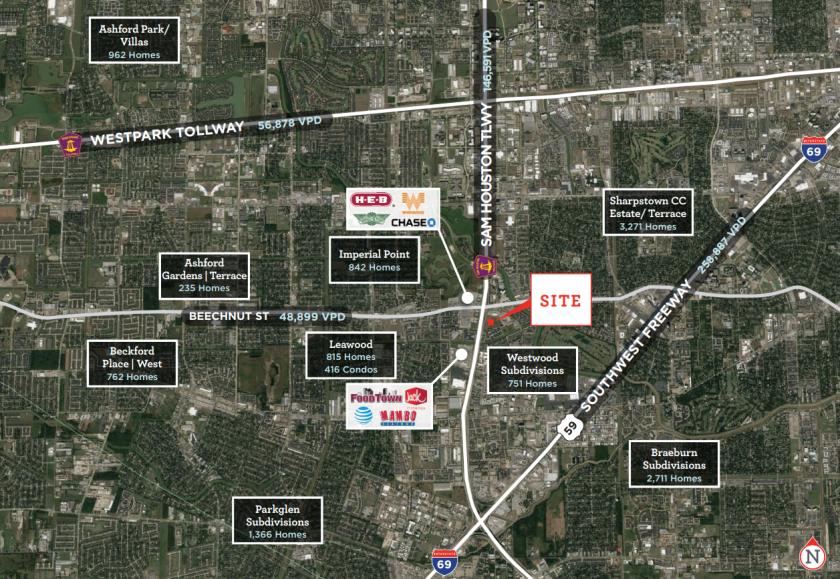
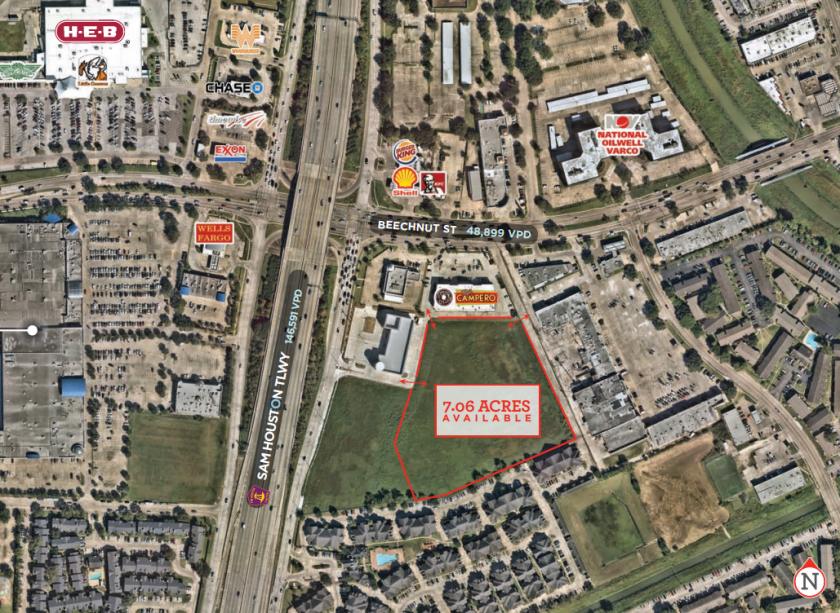
1-Mile | 3-Miles | 5-Miles | ||
---|---|---|---|---|
Total Population | 36,720 | 223,292 | 556,171 | |
Population Median Age | 31 | 34 | 35 | |
Population by Age | 0-9 Yrs | 6314 (17%) | 31885 (14%) | 78844 (14%) |
10-19 Yrs | 5871 (15%) | 33480 (14%) | 72015 (12%) | |
20-29 Yrs | 6768 (18%) | 36914 (16%) | 96902 (17%) | |
30-39 Yrs | 6393 (17%) | 35572 (15%) | 89504 (16%) | |
40-49 Yrs | 4355 (11%) | 29515 (13%) | 71176 (12%) | |
50-59 Yrs | 2813 (7%) | 23816 (10%) | 61477 (11%) | |
60-69 Yrs | 2745 (7%) | 18364 (8%) | 47905 (8%) | |
70+ Yrs | 1461 (3%) | 13747 (6%) | 38347 (6%) | |
Median HH Income | $38,429 | $44,963 | $50,242 | |
Total Household Income | < 24K | 3432 (26%) | 19016 (24%) | 45739 (21%) |
25-49K | 4726 (36%) | 24923 (31%) | 58812 (28%) | |
50-74K | 2645 (20%) | 15421 (19%) | 38530 (18%) | |
75-99K | 952 (7%) | 8510 (10%) | 22677 (10%) | |
100-199K | 936 (7%) | 8849 (11%) | 32694 (15%) | |
200K+ | 139 (1%) | 2307 (2%) | 11525 (5%) | |
Highest Education Level | No Diploma | 8525 | 46497 | 91468 |
Diploma or GED | 5798 | 36320 | 80740 | |
Some College | 2615 | 20785 | 60288 | |
Assoc. Degree | 1364 | 8607 | 23327 | |
Bachelors Degree | 1964 | 18486 | 67359 | |
Higher Degree | 779 | 8243 | 36398 | |
Total Housing Units | 14,644 | 89,083 | 235,503 | |
--Owner-Occupied | 1,895 | 22,603 | 68,438 | |
--Renter-Occupied | 10,935 | 56,424 | 141,539 | |
Owner-Occupied Values | < 100K | 379 | 3440 | 7301 |
100-199K | 916 | 10557 | 24018 | |
200-299K | 440 | 6114 | 17825 | |
300-399K | 119 | 1345 | 8826 | |
400-499K | 24 | 230 | 4124 | |
500K+ | 17 | 916 | 6344 | |
Total Working Age Population | 26,681 | 171,353 | 434,145 | |
In Work Force | 18,147 | 117,685 | 299,152 | |
Not In Work Force | 8,534 | 53,668 | 134,993 | |
Workforce Employed | 16,777 | 108,389 | 277,517 | |
Workforce Unemployed | 1,338 | 9,030 | 21,066 | |
Civlian Workforce | 18,114 | 117,418 | 298,583 | |
Military Workforce | 33 | 267 | 569 | |
Total Households | 12,830 | 79,026 | 209,977 | |
Family Households | 8,884 | 52,689 | 132,147 | |
Non-Family Households | 3,946 | 26,337 | 77,830 | |
Married Couple | 3,514 | 27,732 | 75,750 | |
Other Family | 5,371 | 24,957 | 56,396 | |
Married w/Child | 1,674 | 12,551 | 33,721 | |
Single Male w/Child | 1,029 | 3,272 | 7,029 | |
Single Female w/Child | 2,387 | 10,154 | 22,634 |
Population Change Last Two Decades - Plus Projection
2000 | % | 2010 | % | 2020 | % | 2030 | |
---|---|---|---|---|---|---|---|
Texas | 20,851,820 | +21 | 25,145,561 | +16 | 29,145,505 | +13 | 32,912,882 |
Harris County | 3,400,578 | +20 | 4,092,459 | +16 | 4,731,145 | +10 | 5,226,744 |
Fort Bend County | 354,452 | +65 | 585,375 | +41 | 822,779 | +29 | 1,059,889 |
Total Working Age Population:
Total Households:
Total Working Age Population:
Total Households:
Total Working Age Population:
Total Households: