Retail Space
4061 Spencer Highway Pasadena, TX 77504
4061 Spencer Highway Pasadena, TX 77504
Details & Description
Property Highlights
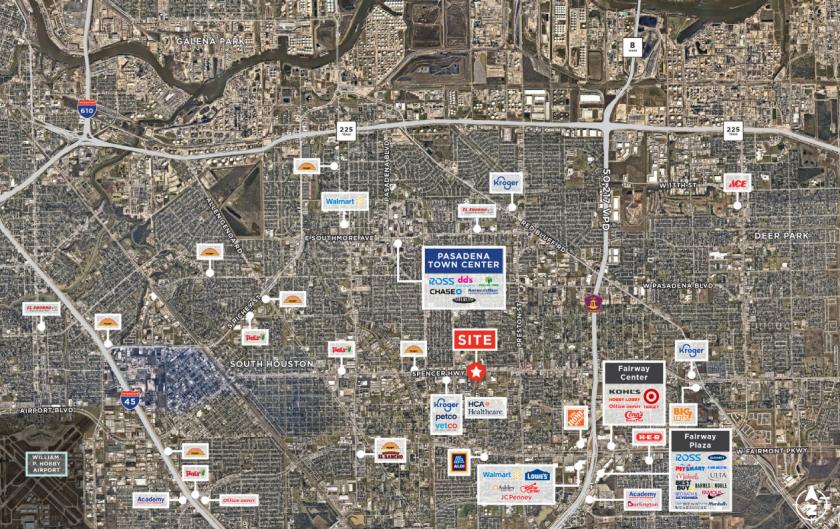
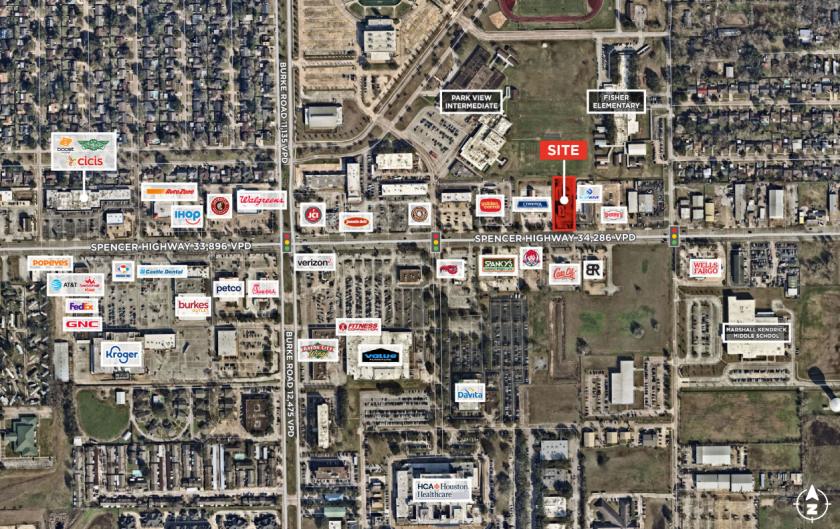
• The location benefits from high traffic counts, with over 32,000 vehicles passing by on Spencer Highway every day.
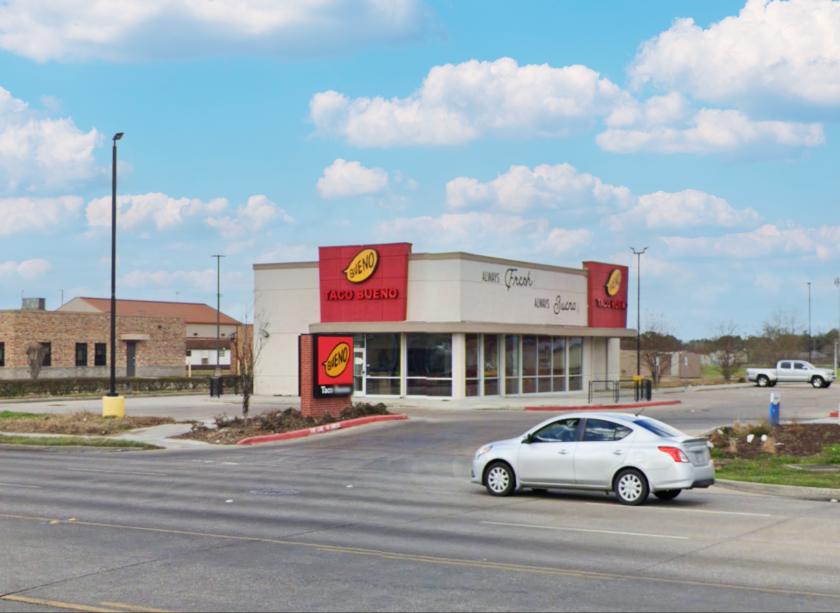
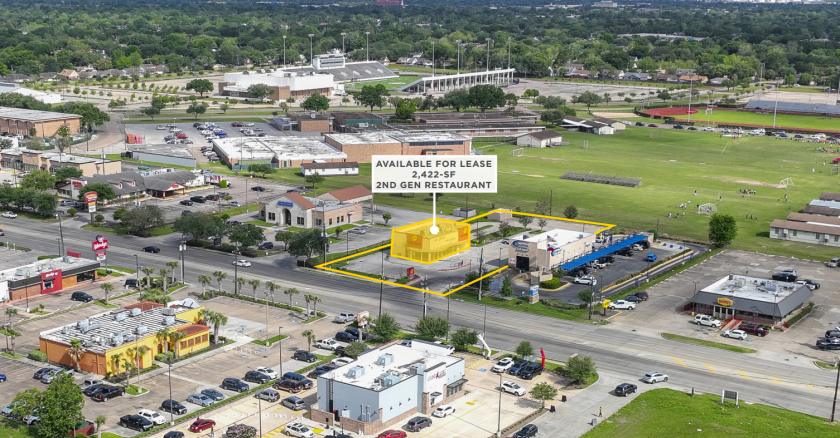
• Formerly a Taco Bueno, this property is a 2,422-SF building with a drive-thru situated on 0.69 acres of land.
Additional Photos
Listing Agents

Andrew Alvis
O: 281-477-5038
andrew.alvis@newquest.com
O: 281-477-5038
andrew.alvis@newquest.com
While we strive to provide the most accurate information, all listing information, and demographic data, is provided by third-parties. As such, MyEListing will not be responsible for the accuracy of the information. It is strongly recommended that you verify all information with the listing agent, and any relevant agencies, prior to making any decisions.


