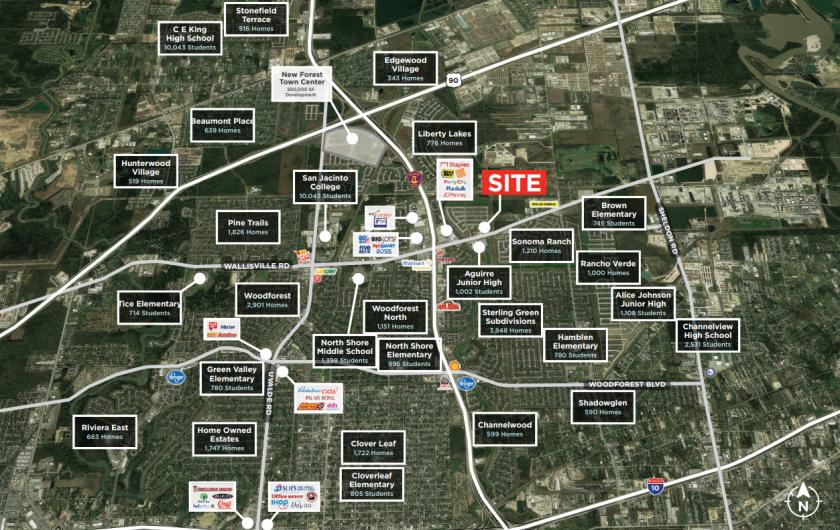
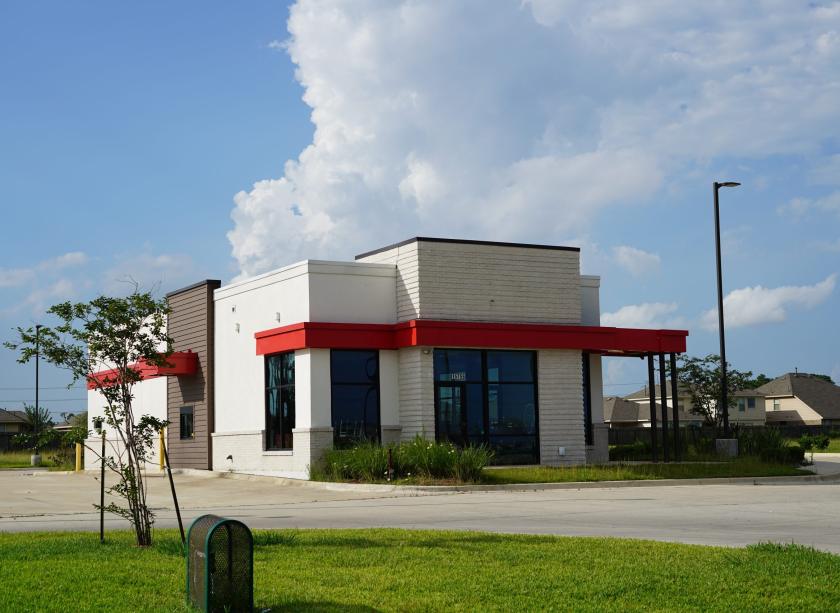
1-Mile | 3-Miles | 5-Miles | ||
---|---|---|---|---|
Total Population | 13,781 | 100,739 | 160,336 | |
Population Median Age | 33 | 32 | 32 | |
Population by Age | 0-9 Yrs | 2221 (16%) | 16585 (16%) | 26625 (16%) |
10-19 Yrs | 2516 (18%) | 19022 (18%) | 29297 (18%) | |
20-29 Yrs | 1997 (14%) | 16003 (15%) | 24989 (15%) | |
30-39 Yrs | 1867 (13%) | 13538 (13%) | 21592 (13%) | |
40-49 Yrs | 1864 (13%) | 13016 (12%) | 21001 (13%) | |
50-59 Yrs | 1352 (9%) | 10823 (10%) | 17463 (10%) | |
60-69 Yrs | 1252 (9%) | 7070 (7%) | 11922 (7%) | |
70+ Yrs | 712 (5%) | 4683 (4%) | 7449 (4%) | |
Median HH Income | $81,000 | $62,022 | $58,604 | |
Total Household Income | < 24K | 275 (6%) | 3761 (12%) | 7242 (15%) |
25-49K | 987 (23%) | 7924 (26%) | 12814 (26%) | |
50-74K | 677 (16%) | 6507 (21%) | 9864 (20%) | |
75-99K | 648 (15%) | 3709 (12%) | 5923 (12%) | |
100-199K | 1366 (32%) | 6708 (22%) | 10259 (21%) | |
200K+ | 237 (5%) | 1160 (3%) | 1620 (3%) | |
Highest Education Level | No Diploma | 1612 | 15577 | 26646 |
Diploma or GED | 2422 | 17632 | 28748 | |
Some College | 2008 | 11380 | 17814 | |
Assoc. Degree | 755 | 4804 | 7187 | |
Bachelors Degree | 828 | 5141 | 8046 | |
Higher Degree | 499 | 1806 | 2509 | |
Total Housing Units | 4,277 | 32,480 | 52,852 | |
--Owner-Occupied | 3,289 | 18,715 | 29,198 | |
--Renter-Occupied | 902 | 11,055 | 18,525 | |
Owner-Occupied Values | < 100K | 253 | 3125 | 5709 |
100-199K | 1357 | 9231 | 14561 | |
200-299K | 1344 | 5343 | 7608 | |
300-399K | 112 | 518 | 719 | |
400-499K | 22 | 170 | 210 | |
500K+ | 202 | 327 | 391 | |
Total Working Age Population | 10,042 | 72,001 | 115,160 | |
In Work Force | 7,107 | 48,683 | 75,922 | |
Not In Work Force | 2,936 | 23,318 | 39,238 | |
Workforce Employed | 6,513 | 45,153 | 69,869 | |
Workforce Unemployed | 594 | 3,480 | 5,961 | |
Civlian Workforce | 7,107 | 48,633 | 75,830 | |
Military Workforce | 0 | 50 | 92 | |
Total Households | 4,191 | 29,770 | 47,723 | |
Family Households | 3,286 | 23,412 | 36,680 | |
Non-Family Households | 904 | 6,358 | 11,043 | |
Married Couple | 2,492 | 15,501 | 23,113 | |
Other Family | 794 | 7,910 | 13,567 | |
Married w/Child | 1,569 | 8,798 | 12,581 | |
Single Male w/Child | 116 | 1,712 | 2,554 | |
Single Female w/Child | 285 | 3,139 | 5,771 |
Population Change Last Two Decades - Plus Projection
2000 | % | 2010 | % | 2020 | % | 2030 | |
---|---|---|---|---|---|---|---|
Texas | 20,851,820 | +21 | 25,145,561 | +16 | 29,145,505 | +13 | 32,912,882 |
Harris County | 3,400,578 | +20 | 4,092,459 | +16 | 4,731,145 | +10 | 5,226,744 |
Total Working Age Population:
Total Households:
Total Working Age Population:
Total Households:
Total Working Age Population:
Total Households: