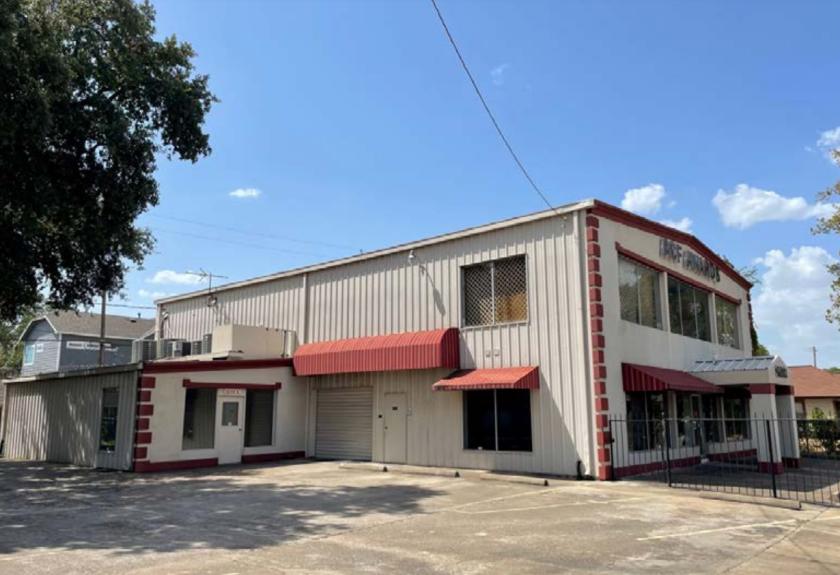
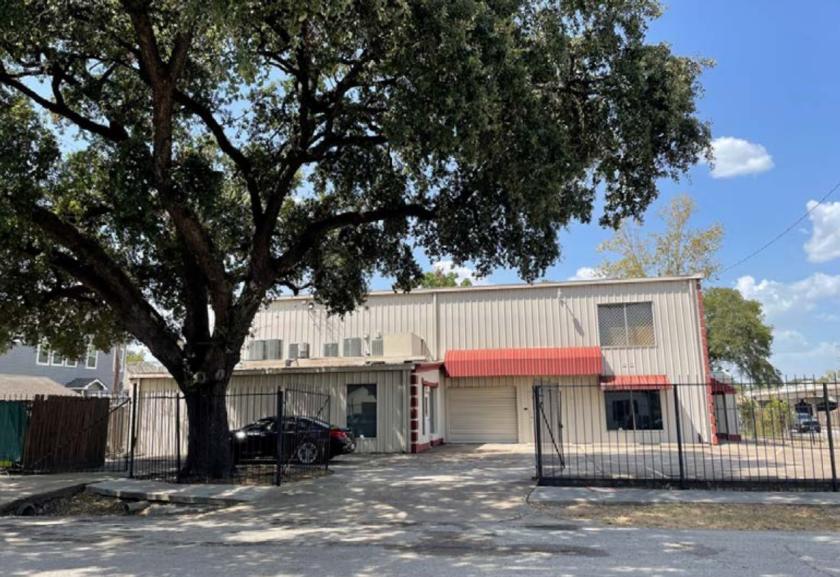
Retail Space
2631 North Freeway Houston, TX 77009
2631 North Freeway Houston, TX 77009
Details & Description
Property Highlights
- • Hard corner site
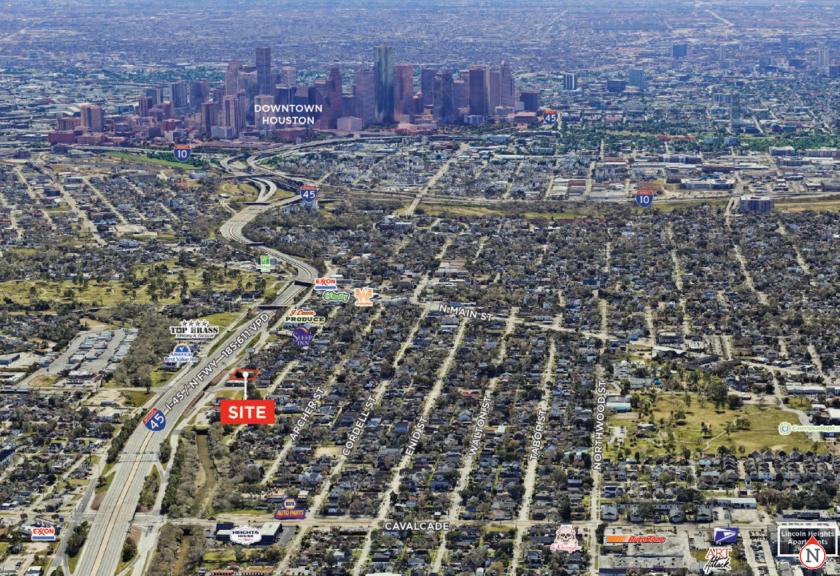
- • Close proximity to Downtown and the Heights
- • Easy access to I-45
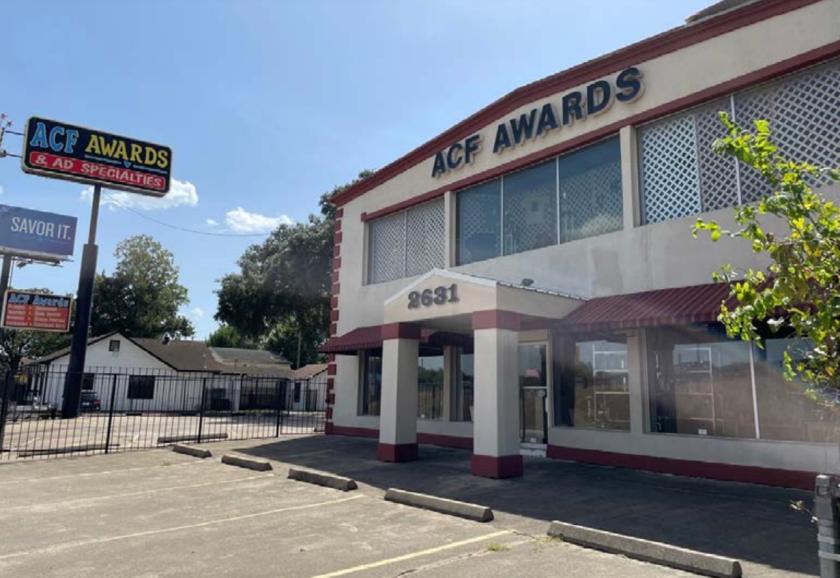
- • Ample parking
- • Building in great condition with operational HVAC
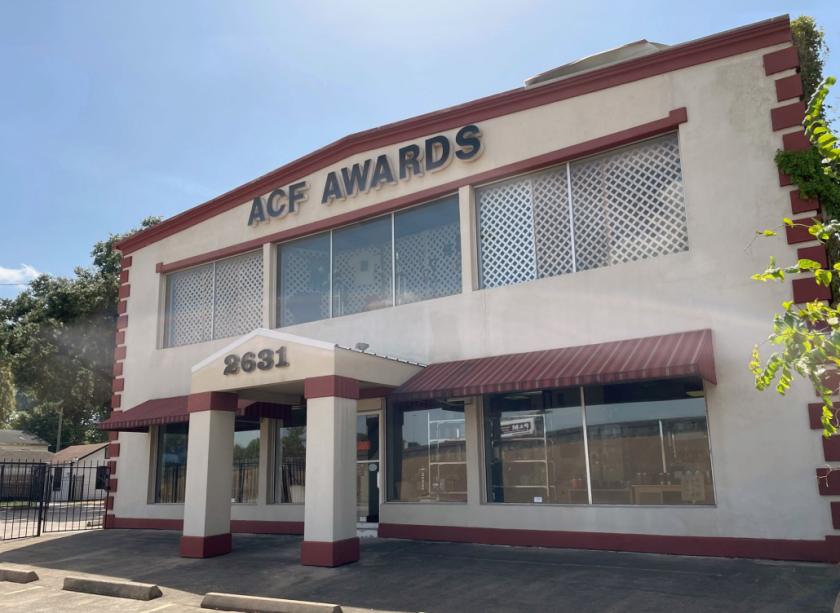
- • Ideal uses: office, medical, retail showroom
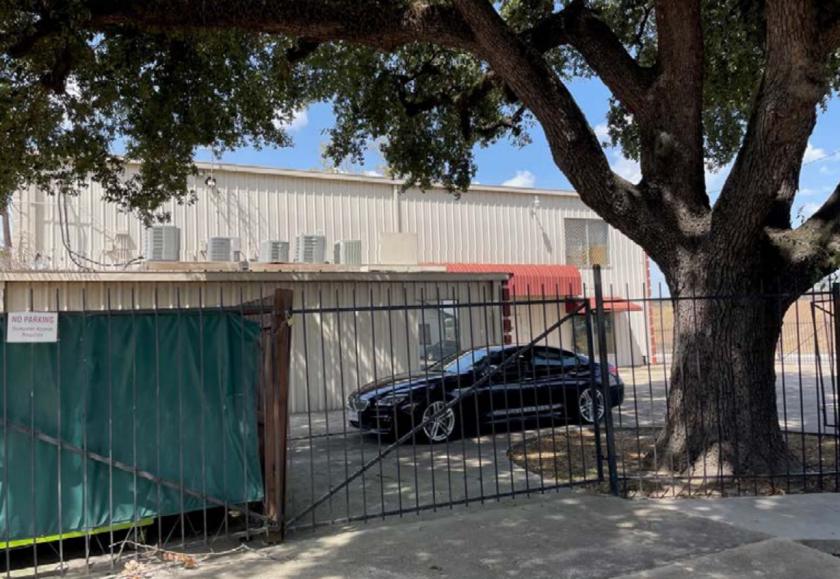
Additional Photos
Listing Agents

Randy Nerren
O: 281-477-4376
rnerren@newquest.com
O: 281-477-4376
rnerren@newquest.com

John Nguyen
O: 281-477-4326
jnguyen@newquest.com
O: 281-477-4326
jnguyen@newquest.com
While we strive to provide the most accurate information, all listing information, and demographic data, is provided by third-parties. As such, MyEListing will not be responsible for the accuracy of the information. It is strongly recommended that you verify all information with the listing agent, and any relevant agencies, prior to making any decisions.