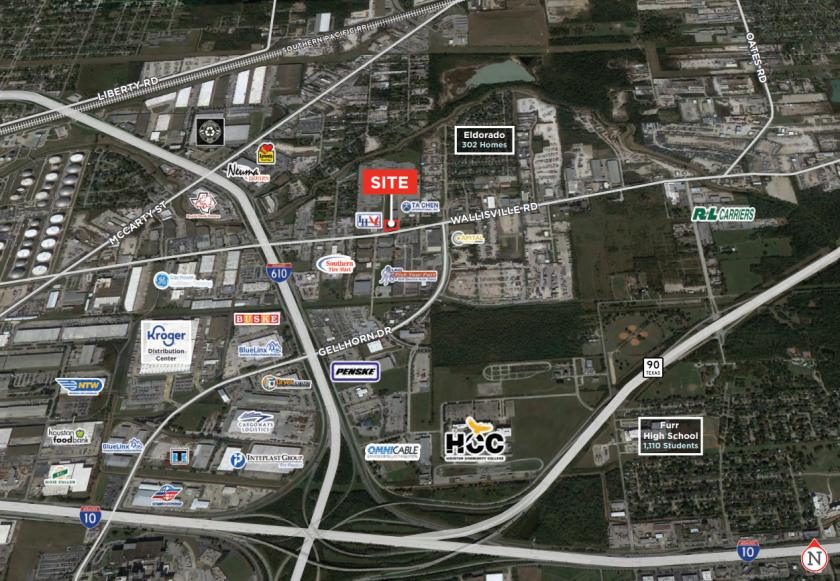
1-Mile | 3-Miles | 5-Miles | ||
---|---|---|---|---|
Total Population | 1,797 | 54,670 | 203,385 | |
Population Median Age | 39 | 36 | 36 | |
Population by Age | 0-9 Yrs | 200 (11%) | 8359 (15%) | 29606 (14%) |
10-19 Yrs | 265 (14%) | 8635 (15%) | 32537 (15%) | |
20-29 Yrs | 231 (12%) | 7654 (14%) | 30145 (14%) | |
30-39 Yrs | 236 (13%) | 6434 (11%) | 24385 (11%) | |
40-49 Yrs | 235 (13%) | 7120 (13%) | 26776 (13%) | |
50-59 Yrs | 198 (11%) | 6524 (11%) | 24462 (12%) | |
60-69 Yrs | 245 (13%) | 5513 (10%) | 19376 (9%) | |
70+ Yrs | 188 (10%) | 4430 (8%) | 16098 (7%) | |
Median HH Income | $59,251 | $45,042 | $45,387 | |
Total Household Income | < 24K | 153 (23%) | 4754 (26%) | 18142 (26%) |
25-49K | 147 (22%) | 5108 (28%) | 19757 (28%) | |
50-74K | 87 (13%) | 3410 (19%) | 12615 (18%) | |
75-99K | 85 (13%) | 1850 (10%) | 6630 (9%) | |
100-199K | 173 (26%) | 2245 (12%) | 9954 (14%) | |
200K+ | 8 (1%) | 331 (1%) | 1381 (2%) | |
Highest Education Level | No Diploma | 473 | 12083 | 41514 |
Diploma or GED | 349 | 11125 | 42309 | |
Some College | 189 | 5601 | 22282 | |
Assoc. Degree | 60 | 1818 | 7190 | |
Bachelors Degree | 88 | 2124 | 9417 | |
Higher Degree | 41 | 615 | 2676 | |
Total Housing Units | 675 | 19,984 | 77,840 | |
--Owner-Occupied | 505 | 9,751 | 35,460 | |
--Renter-Occupied | 148 | 7,948 | 33,019 | |
Owner-Occupied Values | < 100K | 166 | 3879 | 13708 |
100-199K | 271 | 4737 | 16293 | |
200-299K | 54 | 884 | 3630 | |
300-399K | 7 | 163 | 1071 | |
400-499K | 0 | 10 | 311 | |
500K+ | 8 | 78 | 447 | |
Total Working Age Population | 1,477 | 40,933 | 153,356 | |
In Work Force | 825 | 23,628 | 92,081 | |
Not In Work Force | 652 | 17,305 | 61,275 | |
Workforce Employed | 773 | 21,336 | 83,171 | |
Workforce Unemployed | 52 | 2,265 | 8,845 | |
Civlian Workforce | 825 | 23,601 | 92,016 | |
Military Workforce | 0 | 27 | 66 | |
Total Households | 653 | 17,699 | 68,479 | |
Family Households | 487 | 12,400 | 46,448 | |
Non-Family Households | 167 | 5,299 | 22,031 | |
Married Couple | 278 | 6,161 | 23,757 | |
Other Family | 209 | 6,239 | 22,691 | |
Married w/Child | 76 | 2,599 | 10,398 | |
Single Male w/Child | 21 | 549 | 2,330 | |
Single Female w/Child | 39 | 2,575 | 8,215 |
Population Change Last Two Decades - Plus Projection
2000 | % | 2010 | % | 2020 | % | 2030 | |
---|---|---|---|---|---|---|---|
Texas | 20,851,820 | +21 | 25,145,561 | +16 | 29,145,505 | +13 | 32,912,882 |
Harris County | 3,400,578 | +20 | 4,092,459 | +16 | 4,731,145 | +10 | 5,226,744 |
Total Working Age Population:
Total Households:
Total Working Age Population:
Total Households:
Total Working Age Population:
Total Households: