Commercial Land
SH 288 and Business Center Dr Pearland, TX 77584
SH 288 and Business Center Dr Pearland, TX 77584
Details & Description
Property Highlights
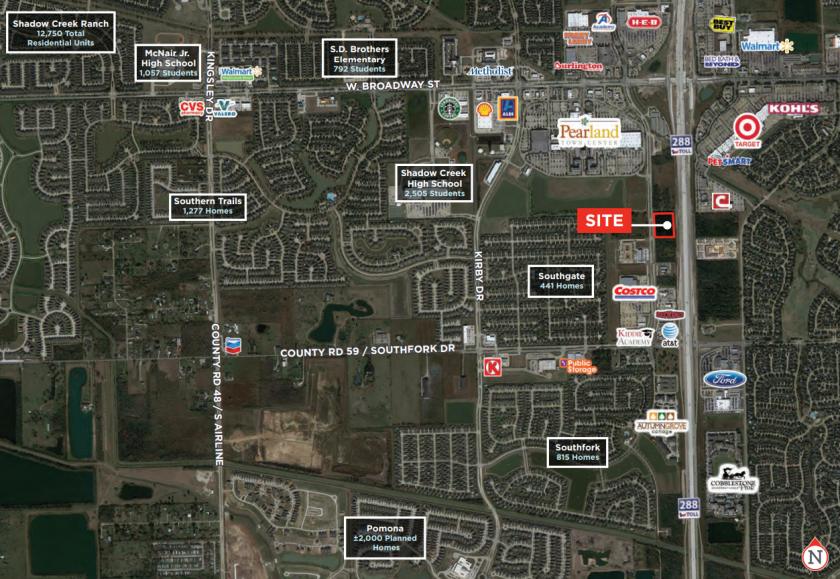
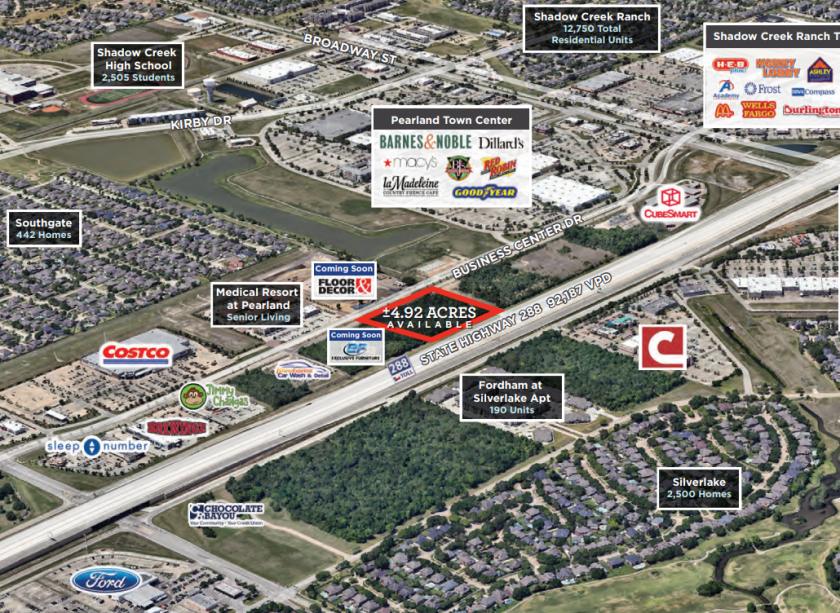
• BP 288 zoning category, which is a liberal zoning code allowing for most commercial uses.
• This prime 4.92 acre site can be accessed by Broadway/CR 59 to Business Center Drive.
Listing Agents

Neal Thomson
O: 713-438-9513
nthomson@newquest.com
O: 713-438-9513
nthomson@newquest.com

Brad LyBrand
O: 713-438-9516
blybrand@newquest.com
O: 713-438-9516
blybrand@newquest.com
While we strive to provide the most accurate information, all listing information, and demographic data, is provided by third-parties. As such, MyEListing will not be responsible for the accuracy of the information. It is strongly recommended that you verify all information with the listing agent, and any relevant agencies, prior to making any decisions.