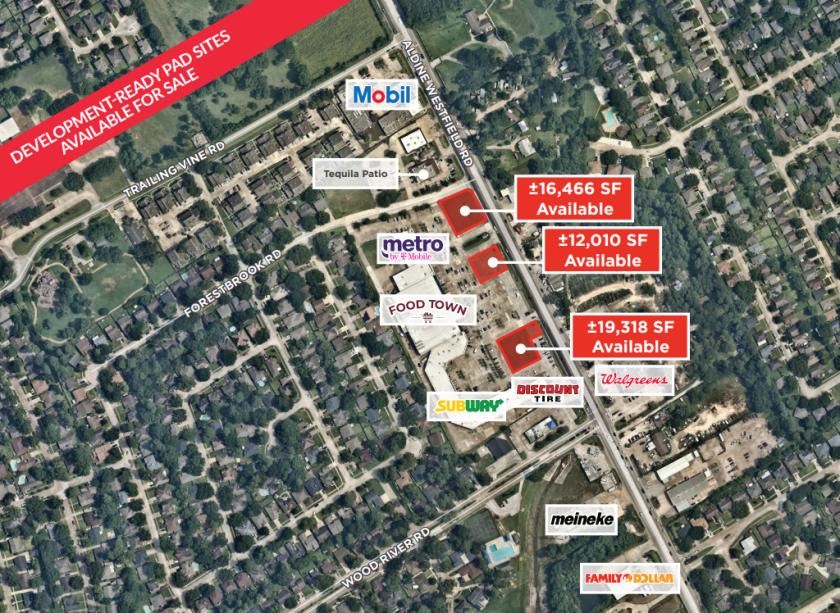
1-Mile | 3-Miles | 5-Miles | ||
---|---|---|---|---|
Total Population | 13,023 | 75,294 | 193,771 | |
Population Median Age | 34 | 34 | 34 | |
Population by Age | 0-9 Yrs | 1912 (14%) | 12206 (16%) | 29631 (15%) |
10-19 Yrs | 1911 (14%) | 9652 (12%) | 29122 (15%) | |
20-29 Yrs | 1928 (14%) | 12863 (17%) | 29636 (15%) | |
30-39 Yrs | 2449 (18%) | 13036 (17%) | 32107 (16%) | |
40-49 Yrs | 1630 (12%) | 8927 (11%) | 26277 (13%) | |
50-59 Yrs | 1176 (9%) | 8143 (10%) | 20934 (10%) | |
60-69 Yrs | 1204 (9%) | 6343 (8%) | 15980 (8%) | |
70+ Yrs | 813 (6%) | 4125 (5%) | 10084 (5%) | |
Median HH Income | $71,334 | $78,136 | $79,743 | |
Total Household Income | < 24K | 512 (11%) | 2636 (10%) | 7274 (10%) |
25-49K | 692 (15%) | 4299 (16%) | 11416 (17%) | |
50-74K | 1153 (26%) | 5375 (20%) | 12649 (19%) | |
75-99K | 802 (18%) | 4402 (17%) | 9215 (13%) | |
100-199K | 1167 (26%) | 7254 (28%) | 19435 (29%) | |
200K+ | 93 (2%) | 1759 (6%) | 6186 (9%) | |
Highest Education Level | No Diploma | 1121 | 5974 | 13039 |
Diploma or GED | 2799 | 13778 | 32847 | |
Some College | 2229 | 12077 | 28774 | |
Assoc. Degree | 714 | 4363 | 11677 | |
Bachelors Degree | 1010 | 8403 | 24413 | |
Higher Degree | 525 | 3322 | 11547 | |
Total Housing Units | 4,848 | 27,543 | 71,183 | |
--Owner-Occupied | 2,939 | 16,496 | 41,375 | |
--Renter-Occupied | 1,480 | 9,228 | 24,799 | |
Owner-Occupied Values | < 100K | 183 | 596 | 1665 |
100-199K | 2168 | 7754 | 15821 | |
200-299K | 543 | 6142 | 15661 | |
300-399K | 18 | 1417 | 4180 | |
400-499K | 4 | 491 | 2101 | |
500K+ | 22 | 97 | 1947 | |
Total Working Age Population | 10,049 | 57,234 | 147,137 | |
In Work Force | 6,929 | 40,741 | 104,692 | |
Not In Work Force | 3,119 | 16,493 | 42,445 | |
Workforce Employed | 6,517 | 38,650 | 99,005 | |
Workforce Unemployed | 369 | 1,877 | 5,148 | |
Civlian Workforce | 6,886 | 40,527 | 104,152 | |
Military Workforce | 43 | 214 | 540 | |
Total Households | 4,419 | 25,724 | 66,174 | |
Family Households | 3,038 | 18,445 | 47,514 | |
Non-Family Households | 1,381 | 7,280 | 18,660 | |
Married Couple | 2,008 | 12,887 | 33,079 | |
Other Family | 1,030 | 5,558 | 14,436 | |
Married w/Child | 965 | 5,931 | 15,991 | |
Single Male w/Child | 124 | 569 | 1,895 | |
Single Female w/Child | 326 | 2,024 | 5,538 |
Population Change Last Two Decades - Plus Projection
2000 | % | 2010 | % | 2020 | % | 2030 | |
---|---|---|---|---|---|---|---|
Texas | 20,851,820 | +21 | 25,145,561 | +16 | 29,145,505 | +13 | 32,912,882 |
Harris County | 3,400,578 | +20 | 4,092,459 | +16 | 4,731,145 | +10 | 5,226,744 |
Montgomery County | 293,768 | +55 | 455,746 | +36 | 620,443 | +27 | 785,953 |
Total Working Age Population:
Total Households:
Total Working Age Population:
Total Households:
Total Working Age Population:
Total Households: