Commercial Land
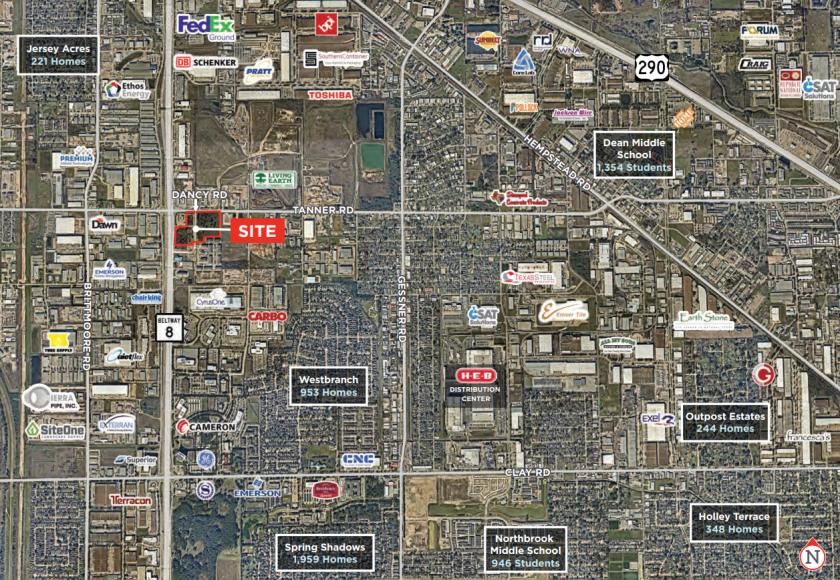
SEC Beltway 8 and Tanner Rd Houston, TX 77041
SEC Beltway 8 and Tanner Rd Houston, TX 77041
Details & Description
Property Highlights
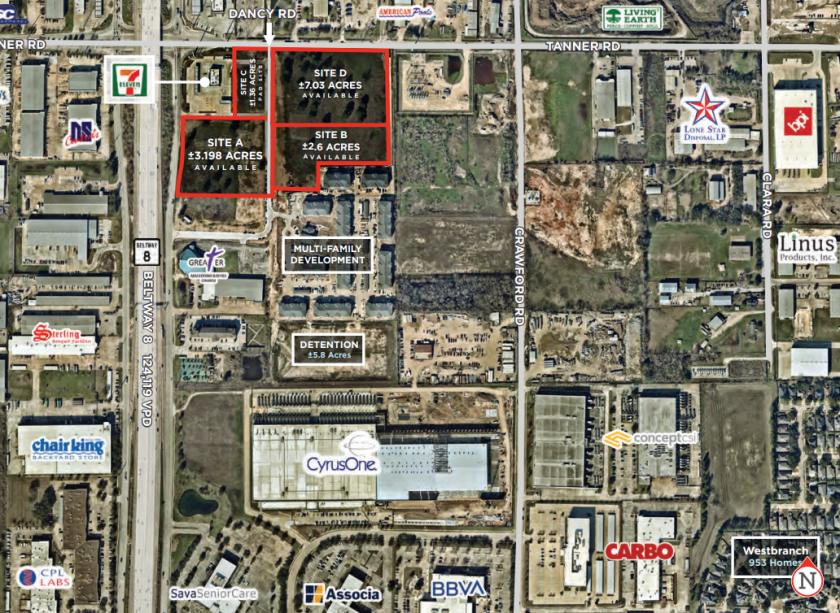
- • Site A: 2.6 acres
- • Site B: 3.198 acres
- • Site C: 1.36 acres
- • Site D: 7.03 acres
Listing Agents

Jeff Lokey
O: 281-477-4380
jlokey@newquest.com
O: 281-477-4380
jlokey@newquest.com

Randy Nerren
O: 281-477-4376
rnerren@newquest.com
O: 281-477-4376
rnerren@newquest.com
While we strive to provide the most accurate information, all listing information, and demographic data, is provided by third-parties. As such, MyEListing will not be responsible for the accuracy of the information. It is strongly recommended that you verify all information with the listing agent, and any relevant agencies, prior to making any decisions.