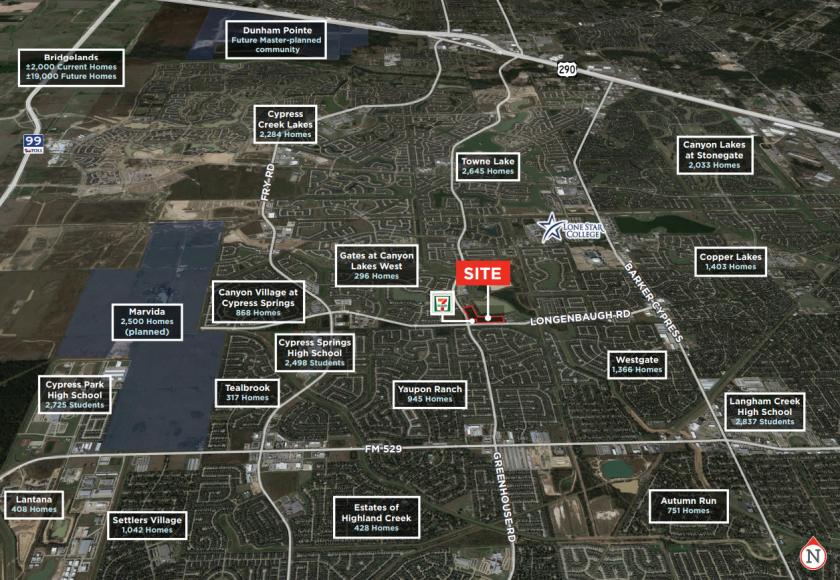
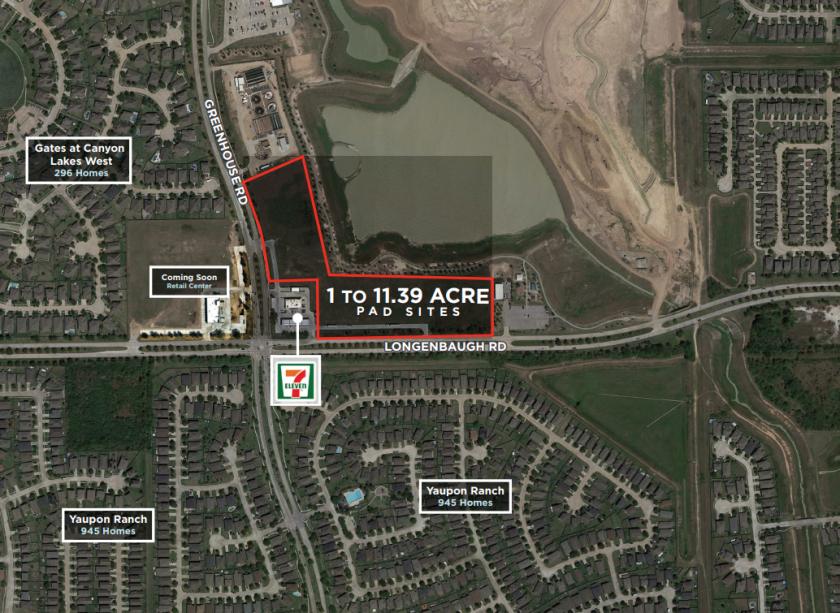
1-Mile | 3-Miles | 5-Miles | ||
---|---|---|---|---|
Total Population | 20,681 | 136,373 | 289,143 | |
Population Median Age | 30 | 33 | 34 | |
Population by Age | 0-9 Yrs | 4155 (20%) | 21498 (15%) | 44770 (15%) |
10-19 Yrs | 4352 (21%) | 24175 (17%) | 48656 (16%) | |
20-29 Yrs | 2127 (10%) | 15086 (11%) | 34911 (12%) | |
30-39 Yrs | 3385 (16%) | 21884 (16%) | 46119 (15%) | |
40-49 Yrs | 3188 (15%) | 20477 (15%) | 41628 (14%) | |
50-59 Yrs | 1601 (7%) | 15247 (11%) | 33677 (11%) | |
60-69 Yrs | 1094 (5%) | 11673 (8%) | 25221 (8%) | |
70+ Yrs | 779 (3%) | 6333 (4%) | 14163 (4%) | |
Median HH Income | $105,154 | $102,277 | $92,624 | |
Total Household Income | < 24K | 361 (6%) | 2572 (6%) | 6630 (7%) |
25-49K | 691 (12%) | 4741 (11%) | 13209 (14%) | |
50-74K | 705 (12%) | 6441 (16%) | 16029 (17%) | |
75-99K | 819 (14%) | 5824 (14%) | 13458 (14%) | |
100-199K | 2324 (42%) | 15078 (37%) | 30295 (33%) | |
200K+ | 608 (11%) | 5566 (13%) | 11092 (12%) | |
Highest Education Level | No Diploma | 1025 | 10087 | 21725 |
Diploma or GED | 2946 | 17657 | 37317 | |
Some College | 2424 | 18817 | 39253 | |
Assoc. Degree | 867 | 7142 | 15313 | |
Bachelors Degree | 3066 | 19625 | 43923 | |
Higher Degree | 1075 | 9851 | 21280 | |
Total Housing Units | 5,642 | 41,443 | 95,109 | |
--Owner-Occupied | 4,457 | 30,909 | 65,658 | |
--Renter-Occupied | 1,051 | 9,312 | 25,055 | |
Owner-Occupied Values | < 100K | 124 | 1093 | 2178 |
100-199K | 1292 | 7939 | 15637 | |
200-299K | 1582 | 11317 | 26583 | |
300-399K | 745 | 5287 | 11926 | |
400-499K | 418 | 2914 | 5054 | |
500K+ | 296 | 2360 | 4281 | |
Total Working Age Population | 13,544 | 98,758 | 212,883 | |
In Work Force | 9,616 | 70,120 | 151,363 | |
Not In Work Force | 3,928 | 28,637 | 61,520 | |
Workforce Employed | 8,971 | 65,800 | 142,407 | |
Workforce Unemployed | 644 | 4,265 | 8,798 | |
Civlian Workforce | 9,616 | 70,065 | 151,205 | |
Military Workforce | 0 | 55 | 158 | |
Total Households | 5,508 | 40,222 | 90,713 | |
Family Households | 4,911 | 33,597 | 72,251 | |
Non-Family Households | 597 | 6,624 | 18,462 | |
Married Couple | 3,737 | 24,983 | 53,790 | |
Other Family | 1,175 | 8,614 | 18,462 | |
Married w/Child | 2,530 | 13,910 | 28,768 | |
Single Male w/Child | 98 | 705 | 2,232 | |
Single Female w/Child | 450 | 3,583 | 7,543 |
Population Change Last Two Decades - Plus Projection
2000 | % | 2010 | % | 2020 | % | 2030 | |
---|---|---|---|---|---|---|---|
Texas | 20,851,820 | +21 | 25,145,561 | +16 | 29,145,505 | +13 | 32,912,882 |
Harris County | 3,400,578 | +20 | 4,092,459 | +16 | 4,731,145 | +10 | 5,226,744 |
Total Working Age Population:
Total Households:
Total Working Age Population:
Total Households:
Total Working Age Population:
Total Households: