Commercial Land
1207-1209 S 1st St Austin, TX 78704
1207-1209 S 1st St Austin, TX 78704
Details & Description
Property Highlights
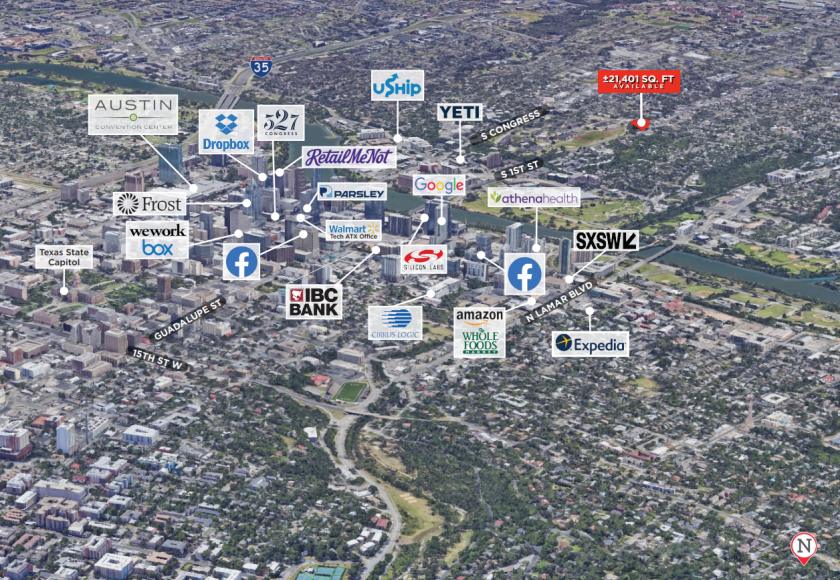
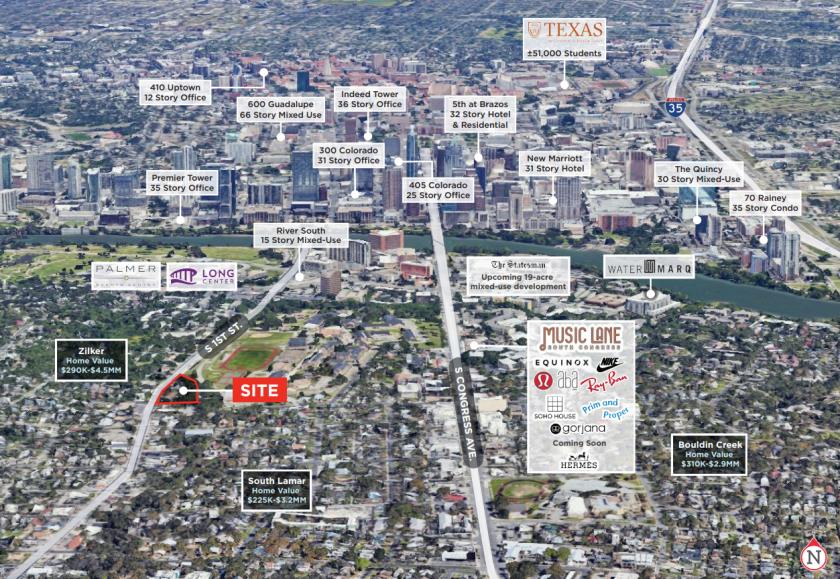
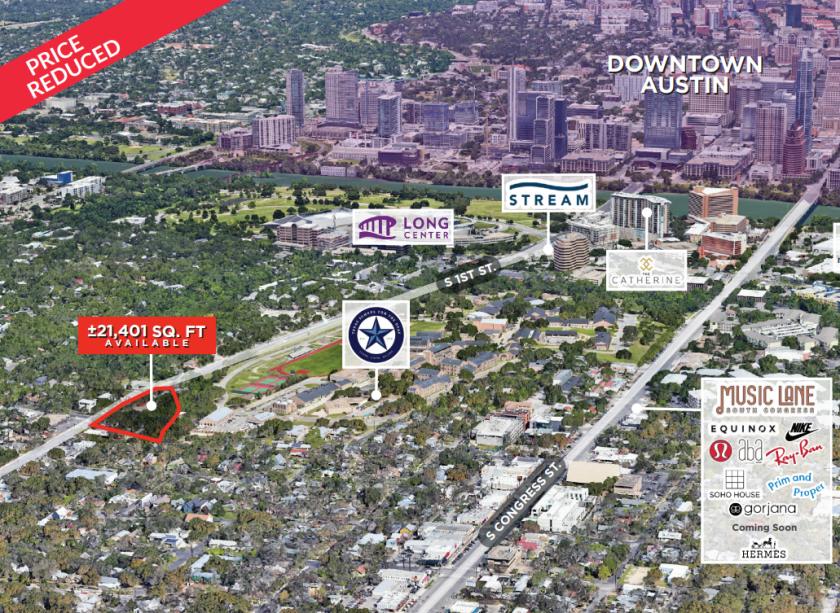
• Great access to all of Austin's greatest amenities at a fraction of the price of downtown.
• Property can be used for multi-family, hospitality, and a variety of mixed-use projects.
Listing Agents

Glenn Dickerson
O: 281-477-4384
gdickerson@newquest.com
O: 281-477-4384
gdickerson@newquest.com

Brad LyBrand
O: 713-438-9516
blybrand@newquest.com
O: 713-438-9516
blybrand@newquest.com
While we strive to provide the most accurate information, all listing information, and demographic data, is provided by third-parties. As such, MyEListing will not be responsible for the accuracy of the information. It is strongly recommended that you verify all information with the listing agent, and any relevant agencies, prior to making any decisions.