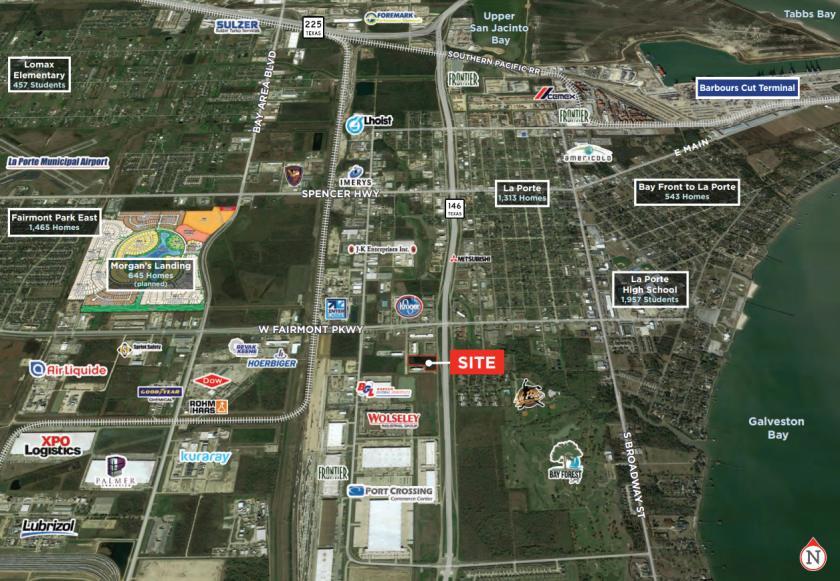
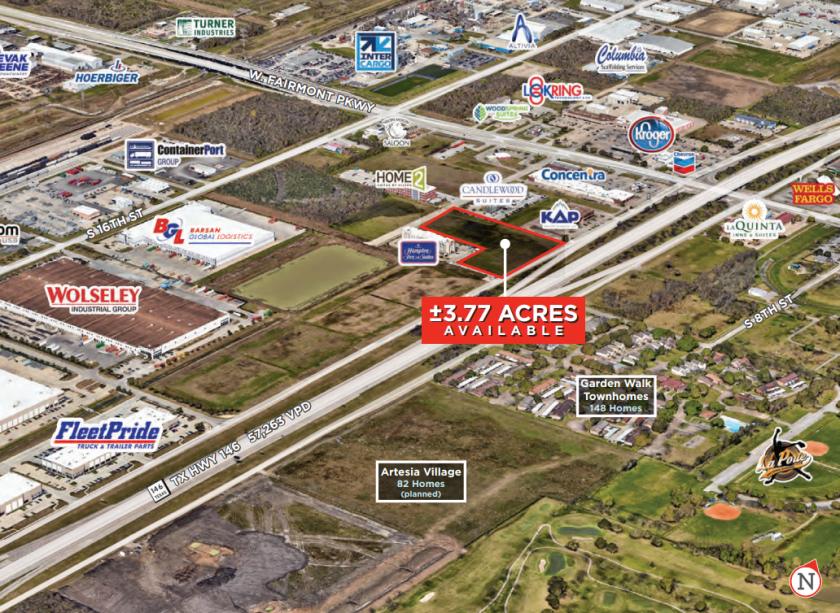
1-Mile | 3-Miles | 5-Miles | ||
---|---|---|---|---|
Total Population | 2,323 | 22,259 | 55,530 | |
Population Median Age | 35 | 38 | 38 | |
Population by Age | 0-9 Yrs | 464 (19%) | 3196 (14%) | 7609 (13%) |
10-19 Yrs | 265 (11%) | 2715 (12%) | 7925 (14%) | |
20-29 Yrs | 258 (11%) | 2907 (13%) | 6443 (11%) | |
30-39 Yrs | 321 (13%) | 2860 (12%) | 7174 (12%) | |
40-49 Yrs | 383 (16%) | 3078 (13%) | 7569 (13%) | |
50-59 Yrs | 272 (11%) | 2798 (12%) | 6988 (12%) | |
60-69 Yrs | 211 (9%) | 2555 (11%) | 6379 (11%) | |
70+ Yrs | 149 (6%) | 2150 (9%) | 5443 (9%) | |
Median HH Income | $70,435 | $90,580 | $96,026 | |
Total Household Income | < 24K | 105 (12%) | 863 (10%) | 2151 (10%) |
25-49K | 187 (22%) | 1237 (15%) | 2838 (14%) | |
50-74K | 149 (18%) | 1096 (13%) | 2915 (14%) | |
75-99K | 94 (11%) | 1177 (14%) | 2392 (12%) | |
100-199K | 250 (30%) | 2569 (32%) | 7001 (35%) | |
200K+ | 41 (4%) | 918 (11%) | 2535 (12%) | |
Highest Education Level | No Diploma | 209 | 1874 | 3561 |
Diploma or GED | 386 | 4505 | 10192 | |
Some College | 447 | 4333 | 9598 | |
Assoc. Degree | 125 | 1515 | 3740 | |
Bachelors Degree | 253 | 1916 | 6303 | |
Higher Degree | 85 | 879 | 3485 | |
Total Housing Units | 901 | 8,362 | 20,905 | |
--Owner-Occupied | 572 | 6,010 | 15,120 | |
--Renter-Occupied | 255 | 1,851 | 4,712 | |
Owner-Occupied Values | < 100K | 107 | 627 | 1440 |
100-199K | 164 | 2135 | 4430 | |
200-299K | 239 | 2327 | 5275 | |
300-399K | 32 | 478 | 2248 | |
400-499K | 2 | 195 | 1016 | |
500K+ | 28 | 248 | 711 | |
Total Working Age Population | 1,705 | 17,374 | 43,084 | |
In Work Force | 1,001 | 11,238 | 27,771 | |
Not In Work Force | 703 | 6,136 | 15,312 | |
Workforce Employed | 982 | 10,674 | 26,392 | |
Workforce Unemployed | 20 | 564 | 1,375 | |
Civlian Workforce | 1,001 | 11,238 | 27,767 | |
Military Workforce | 0 | 0 | 4 | |
Total Households | 827 | 7,861 | 19,832 | |
Family Households | 536 | 5,575 | 14,697 | |
Non-Family Households | 290 | 2,286 | 5,135 | |
Married Couple | 390 | 4,286 | 11,603 | |
Other Family | 146 | 1,289 | 3,093 | |
Married w/Child | 206 | 1,683 | 4,650 | |
Single Male w/Child | 3 | 37 | 179 | |
Single Female w/Child | 54 | 423 | 1,243 |
Population Change Last Two Decades - Plus Projection
2000 | % | 2010 | % | 2020 | % | 2030 | |
---|---|---|---|---|---|---|---|
Texas | 20,851,820 | +21 | 25,145,561 | +16 | 29,145,505 | +13 | 32,912,882 |
Harris County | 3,400,578 | +20 | 4,092,459 | +16 | 4,731,145 | +10 | 5,226,744 |
Chambers County | 26,031 | +35 | 35,096 | +33 | 46,571 | +28 | 59,552 |
Total Working Age Population:
Total Households:
Total Working Age Population:
Total Households:
Total Working Age Population:
Total Households: