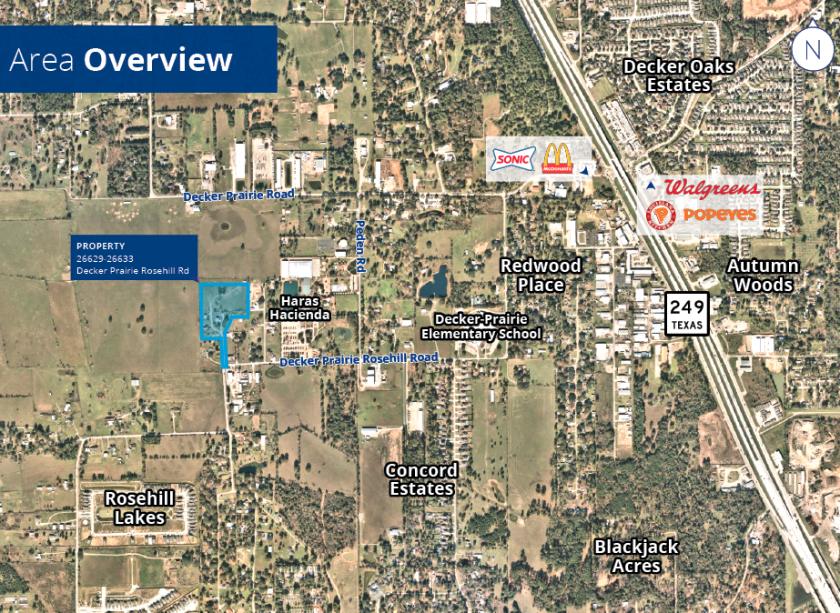
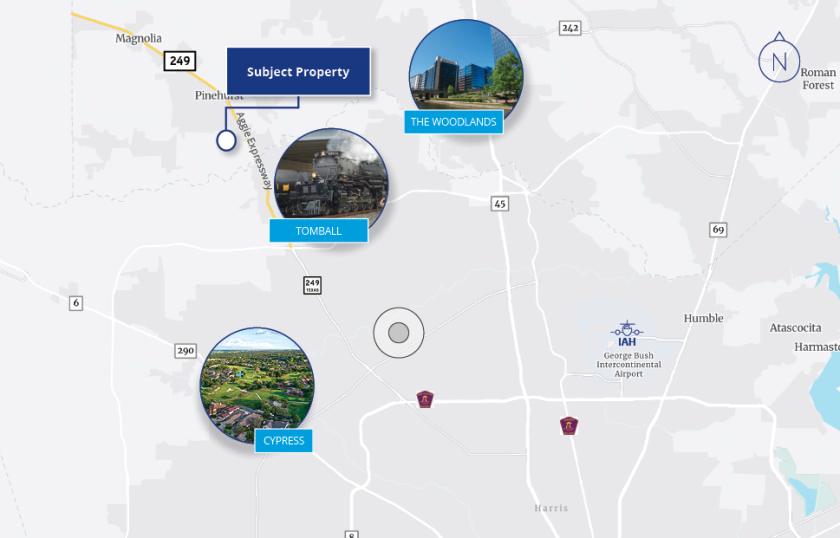
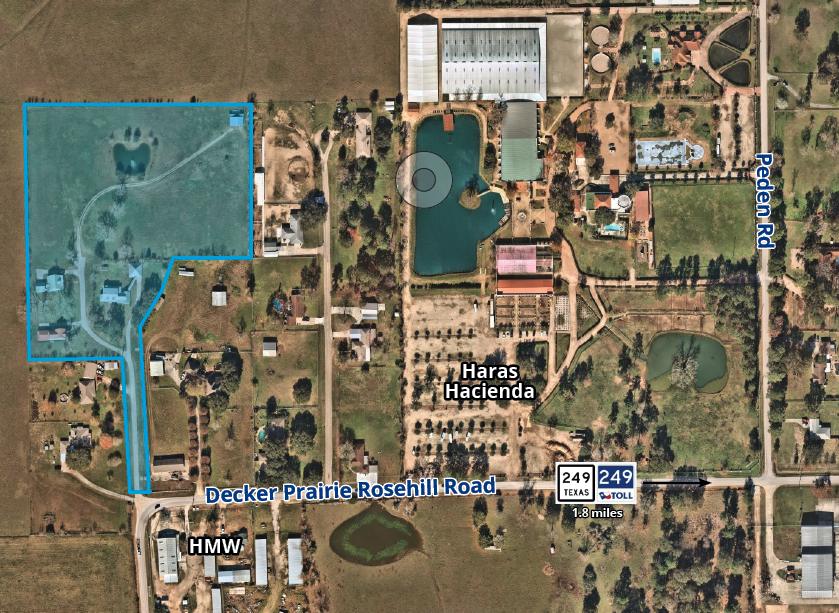
1-Mile | 3-Miles | 5-Miles | ||
---|---|---|---|---|
Total Population | 1,476 | 17,070 | 46,663 | |
Population Median Age | 34 | 38 | 39 | |
Population by Age | 0-9 Yrs | 108 (7%) | 1760 (10%) | 5609 (12%) |
10-19 Yrs | 497 (33%) | 2833 (16%) | 6718 (14%) | |
20-29 Yrs | 126 (8%) | 2237 (13%) | 5900 (12%) | |
30-39 Yrs | 146 (9%) | 1636 (9%) | 5361 (11%) | |
40-49 Yrs | 211 (14%) | 3045 (17%) | 6587 (14%) | |
50-59 Yrs | 118 (7%) | 1787 (10%) | 5401 (11%) | |
60-69 Yrs | 193 (13%) | 2325 (13%) | 6512 (13%) | |
70+ Yrs | 77 (5%) | 1447 (8%) | 4574 (9%) | |
Median HH Income | $70,463 | $109,375 | $93,228 | |
Total Household Income | < 24K | 131 (31%) | 721 (13%) | 2297 (14%) |
25-49K | 45 (10%) | 459 (8%) | 2068 (13%) | |
50-74K | 43 (10%) | 550 (10%) | 2009 (12%) | |
75-99K | 14 (3%) | 822 (14%) | 2043 (12%) | |
100-199K | 136 (32%) | 1805 (32%) | 4447 (28%) | |
200K+ | 50 (11%) | 1125 (20%) | 2863 (18%) | |
Highest Education Level | No Diploma | 40 | 781 | 3404 |
Diploma or GED | 287 | 2991 | 8480 | |
Some College | 193 | 2736 | 7478 | |
Assoc. Degree | 44 | 1070 | 2672 | |
Bachelors Degree | 159 | 2577 | 6105 | |
Higher Degree | 49 | 1017 | 2995 | |
Total Housing Units | 419 | 5,870 | 16,862 | |
--Owner-Occupied | 377 | 4,833 | 11,838 | |
--Renter-Occupied | 42 | 649 | 3,889 | |
Owner-Occupied Values | < 100K | 150 | 793 | 1578 |
100-199K | 16 | 503 | 1711 | |
200-299K | 77 | 1209 | 2686 | |
300-399K | 71 | 667 | 1565 | |
400-499K | 24 | 563 | 971 | |
500K+ | 40 | 1098 | 3327 | |
Total Working Age Population | 1,232 | 13,775 | 36,973 | |
In Work Force | 717 | 8,319 | 22,479 | |
Not In Work Force | 515 | 5,455 | 14,493 | |
Workforce Employed | 677 | 7,839 | 21,356 | |
Workforce Unemployed | 40 | 481 | 1,124 | |
Civlian Workforce | 717 | 8,319 | 22,479 | |
Military Workforce | 0 | 0 | 0 | |
Total Households | 419 | 5,482 | 15,726 | |
Family Households | 380 | 4,576 | 12,260 | |
Non-Family Households | 39 | 906 | 3,466 | |
Married Couple | 247 | 3,742 | 9,712 | |
Other Family | 132 | 834 | 2,548 | |
Married w/Child | 76 | 1,548 | 3,866 | |
Single Male w/Child | 1 | 3 | 204 | |
Single Female w/Child | 117 | 388 | 1,074 |
Population Change Last Two Decades - Plus Projection
2000 | % | 2010 | % | 2020 | % | 2030 | |
---|---|---|---|---|---|---|---|
Texas | 20,851,820 | +21 | 25,145,561 | +16 | 29,145,505 | +13 | 32,912,882 |
Harris County | 3,400,578 | +20 | 4,092,459 | +16 | 4,731,145 | +10 | 5,226,744 |
Montgomery County | 293,768 | +55 | 455,746 | +36 | 620,443 | +27 | 785,953 |
Total Working Age Population:
Total Households:
Total Working Age Population:
Total Households:
Total Working Age Population:
Total Households: