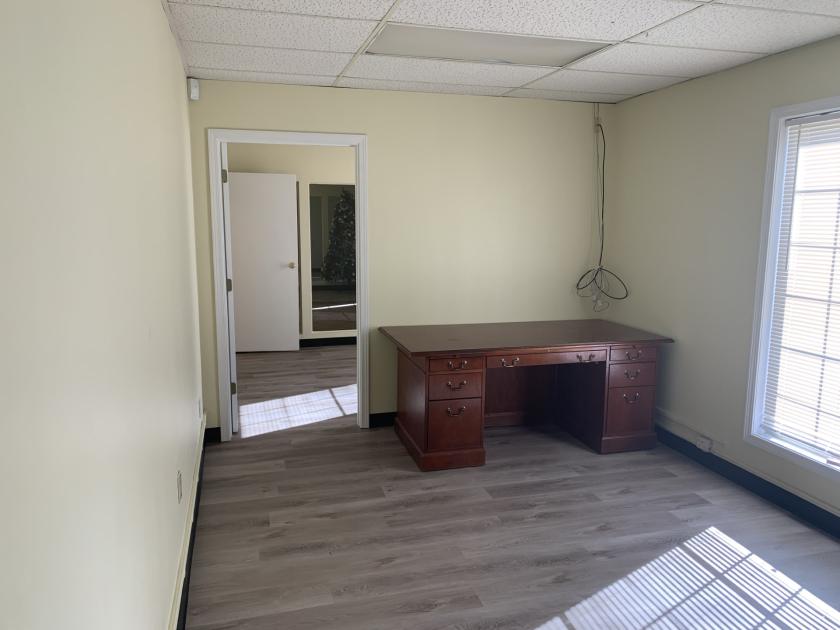
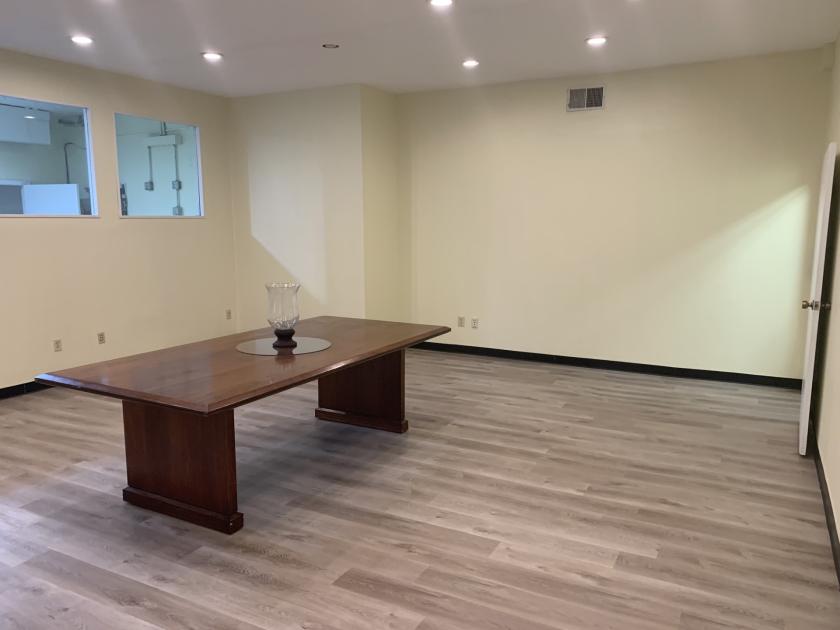
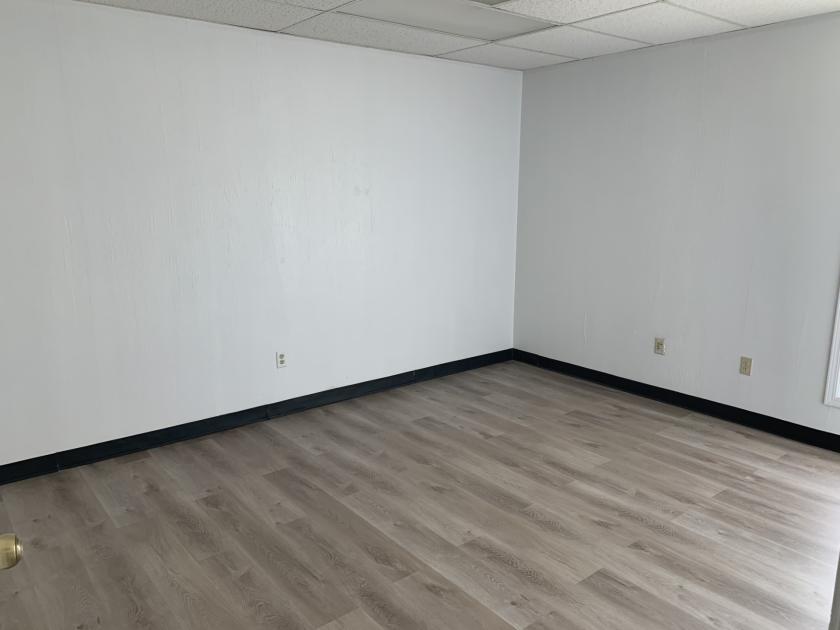
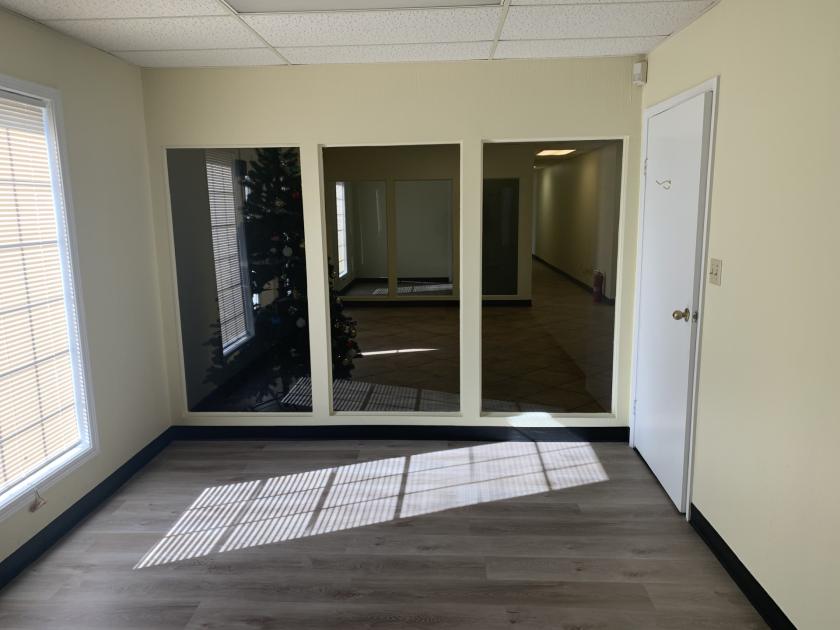
1-Mile | 3-Miles | 5-Miles | ||
---|---|---|---|---|
Total Population | 846 | 46,785 | 159,952 | |
Population Median Age | 49 | 39 | 39 | |
Population by Age | 0-9 Yrs | 53 (6%) | 5743 (12%) | 19794 (12%) |
10-19 Yrs | 73 (8%) | 5928 (12%) | 19635 (12%) | |
20-29 Yrs | 72 (8%) | 6894 (14%) | 23756 (14%) | |
30-39 Yrs | 78 (9%) | 5836 (12%) | 22010 (13%) | |
40-49 Yrs | 61 (7%) | 5660 (12%) | 19118 (11%) | |
50-59 Yrs | 197 (23%) | 5888 (12%) | 19930 (12%) | |
60-69 Yrs | 147 (17%) | 5723 (12%) | 19135 (11%) | |
70+ Yrs | 164 (19%) | 5112 (10%) | 16574 (10%) | |
Median HH Income | $36,975 | $51,504 | $52,619 | |
Total Household Income | < 24K | 115 (26%) | 5207 (25%) | 17715 (25%) |
25-49K | 171 (38%) | 4826 (23%) | 15963 (22%) | |
50-74K | 59 (13%) | 4029 (19%) | 12770 (18%) | |
75-99K | 46 (10%) | 2355 (11%) | 8746 (12%) | |
100-199K | 32 (7%) | 3482 (16%) | 12306 (17%) | |
200K+ | 19 (4%) | 735 (3%) | 2688 (3%) | |
Highest Education Level | No Diploma | 150 | 3831 | 11630 |
Diploma or GED | 193 | 11135 | 33684 | |
Some College | 167 | 7705 | 28369 | |
Assoc. Degree | 50 | 2982 | 11153 | |
Bachelors Degree | 95 | 4138 | 15261 | |
Higher Degree | 19 | 1831 | 9235 | |
Total Housing Units | 466 | 22,323 | 79,651 | |
--Owner-Occupied | 351 | 11,805 | 37,577 | |
--Renter-Occupied | 91 | 8,829 | 32,610 | |
Owner-Occupied Values | < 100K | 242 | 4863 | 14748 |
100-199K | 72 | 5136 | 15453 | |
200-299K | 26 | 1312 | 5292 | |
300-399K | 10 | 345 | 1372 | |
400-499K | 0 | 114 | 361 | |
500K+ | 0 | 34 | 351 | |
Total Working Age Population | 750 | 37,154 | 127,549 | |
In Work Force | 387 | 22,982 | 80,575 | |
Not In Work Force | 363 | 14,172 | 46,974 | |
Workforce Employed | 373 | 21,302 | 73,537 | |
Workforce Unemployed | 14 | 1,456 | 5,612 | |
Civlian Workforce | 387 | 22,758 | 79,149 | |
Military Workforce | 0 | 224 | 1,426 | |
Total Households | 442 | 20,634 | 70,188 | |
Family Households | 192 | 11,697 | 37,986 | |
Non-Family Households | 249 | 8,937 | 32,202 | |
Married Couple | 157 | 6,492 | 21,939 | |
Other Family | 35 | 5,205 | 16,047 | |
Married w/Child | 53 | 2,042 | 7,505 | |
Single Male w/Child | 2 | 948 | 2,173 | |
Single Female w/Child | 7 | 2,072 | 6,786 |
Population Change Last Two Decades - Plus Projection
2000 | % | 2010 | % | 2020 | % | 2030 | |
---|---|---|---|---|---|---|---|
Ohio | 11,353,140 | +2 | 11,536,504 | +2 | 11,799,448 | -2 | 11,615,100 |
Miami County | 98,868 | +4 | 102,506 | +6 | 108,774 | -5 | 103,500 |
Greene County | 147,886 | +9 | 161,573 | +4 | 167,966 | -1 | 165,780 |
Montgomery County | 559,062 | -4 | 535,153 | 0 | 537,309 | -8 | 496,650 |
Total Working Age Population:
Total Households:
Total Working Age Population:
Total Households:
Total Working Age Population:
Total Households: