Industrial Properties
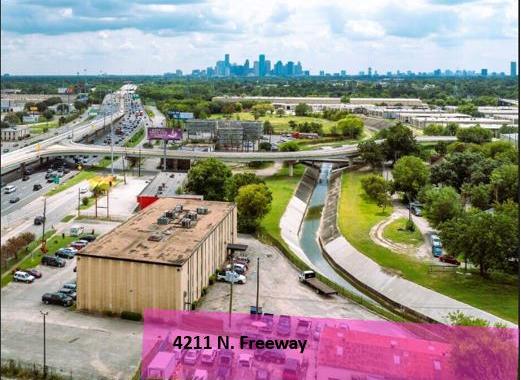
4211 North Freeway Houston, TX 77022
4211 North Freeway Houston, TX 77022
Details & Description
Property Highlights
- • Warehouse Storage Building
- • Office and Warehouse here!
- • Easy access to I-45 and I-610
Listing Agents

Trent Vacek
O: 713-961-4666
tvacek@cmirealestate.com
O: 713-961-4666
tvacek@cmirealestate.com
While we strive to provide the most accurate information, all listing information, and demographic data, is provided by third-parties. As such, MyEListing will not be responsible for the accuracy of the information. It is strongly recommended that you verify all information with the listing agent, and any relevant agencies, prior to making any decisions.


