Industrial Properties
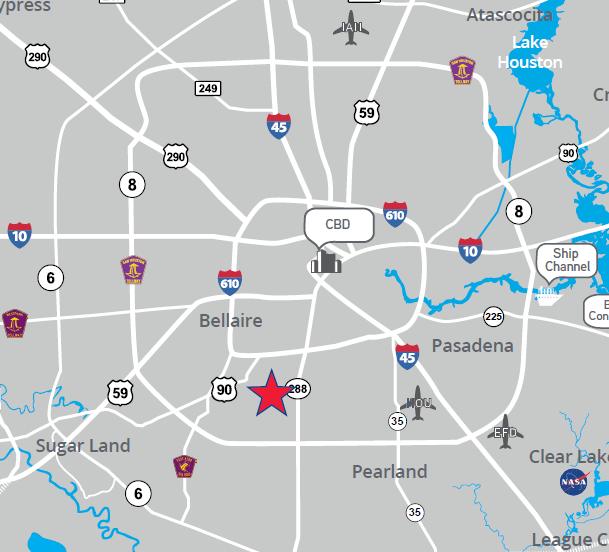
12245 Robin Boulevard Houston, TX 77045
12245 Robin Boulevard Houston, TX 77045
Details & Description
Property Highlights
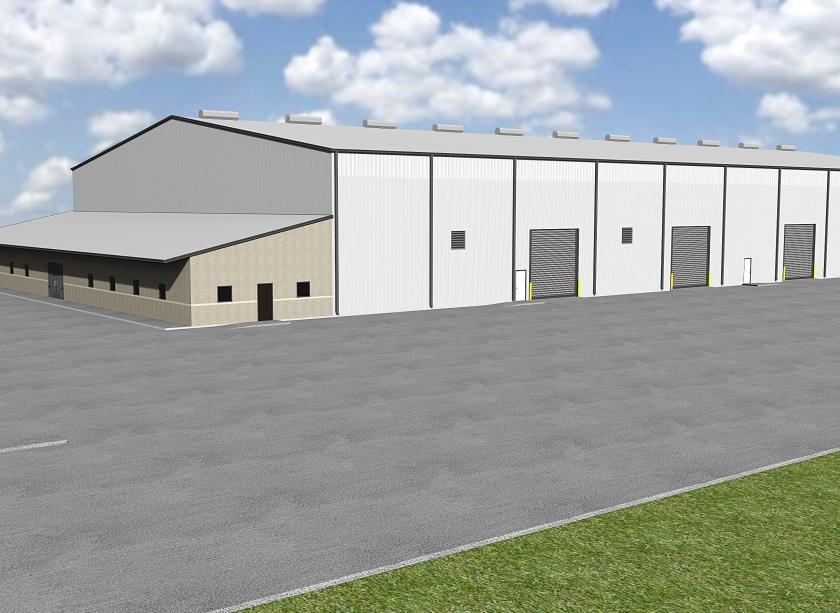
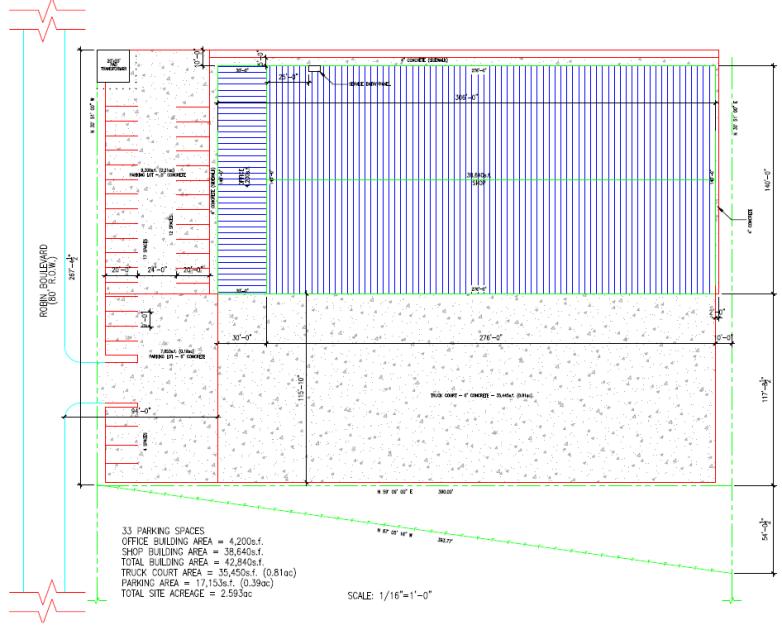
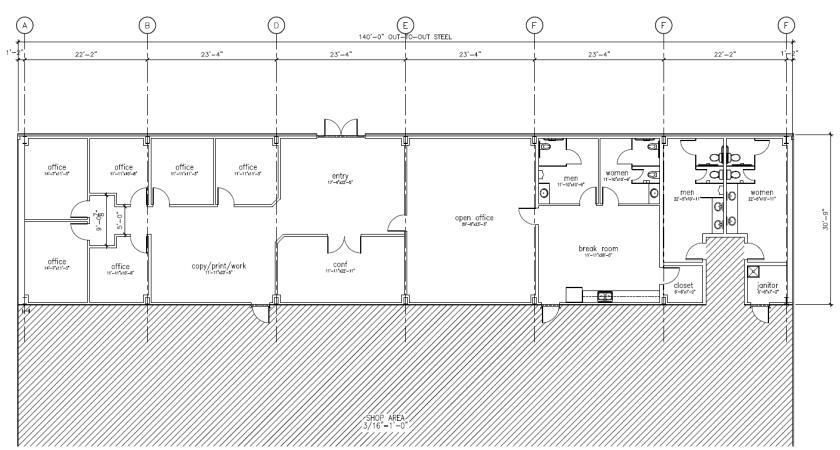
- • 42,280 SF total building area
- • 4,200 SF office area
- • 38,640 SF shop area
- • 36,975 SF (0.85 acre) truck court
- • 33 parking spaces
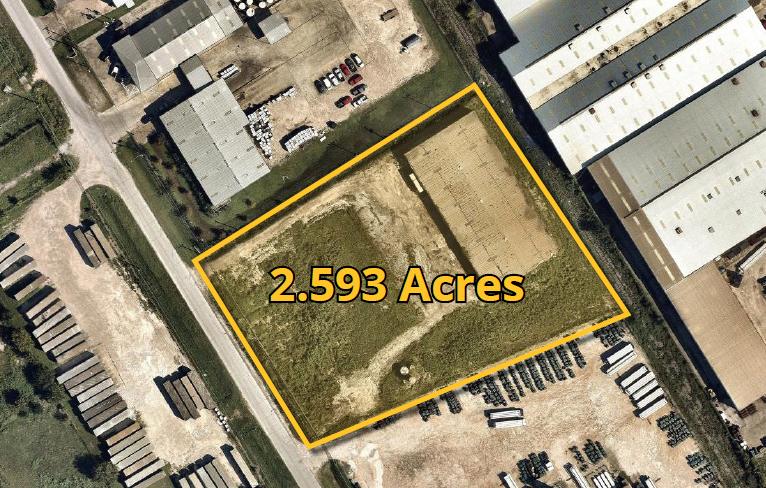
- • ±2.593 acre site
Additional Photos

Listing Agents

Blake Gibson
O: 713-830-2173
blake.gibson@colliers.com
O: 713-830-2173
blake.gibson@colliers.com
While we strive to provide the most accurate information, all listing information, and demographic data, is provided by third-parties. As such, MyEListing will not be responsible for the accuracy of the information. It is strongly recommended that you verify all information with the listing agent, and any relevant agencies, prior to making any decisions.